Monitoring
How to monitor Redis? What alert rules are worth paying attention to?
Dashboards
The REDIS module provides 3 monitoring dashboards:
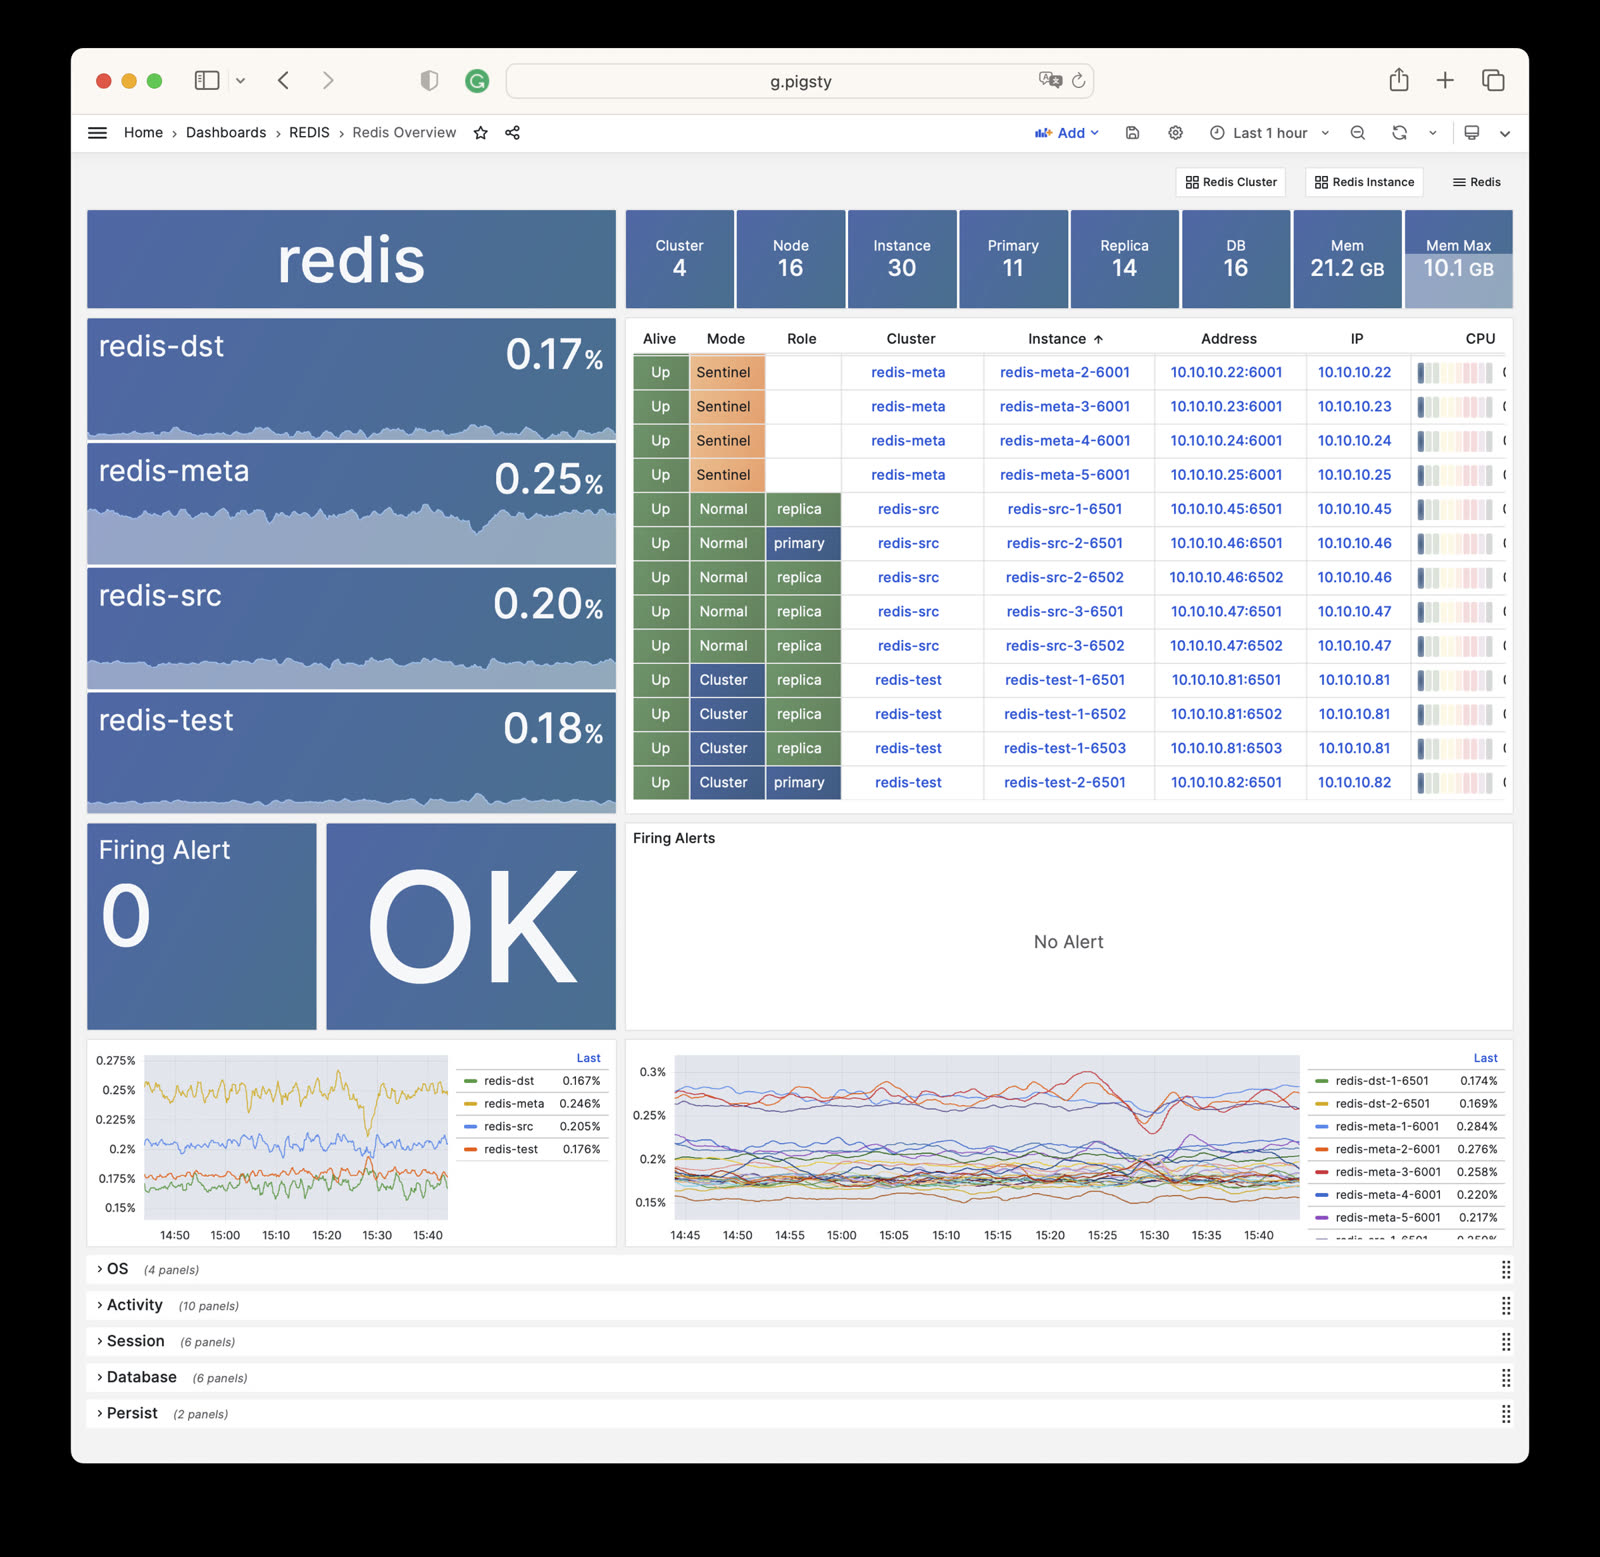
Redis Overview: Overview of all Redis clusters
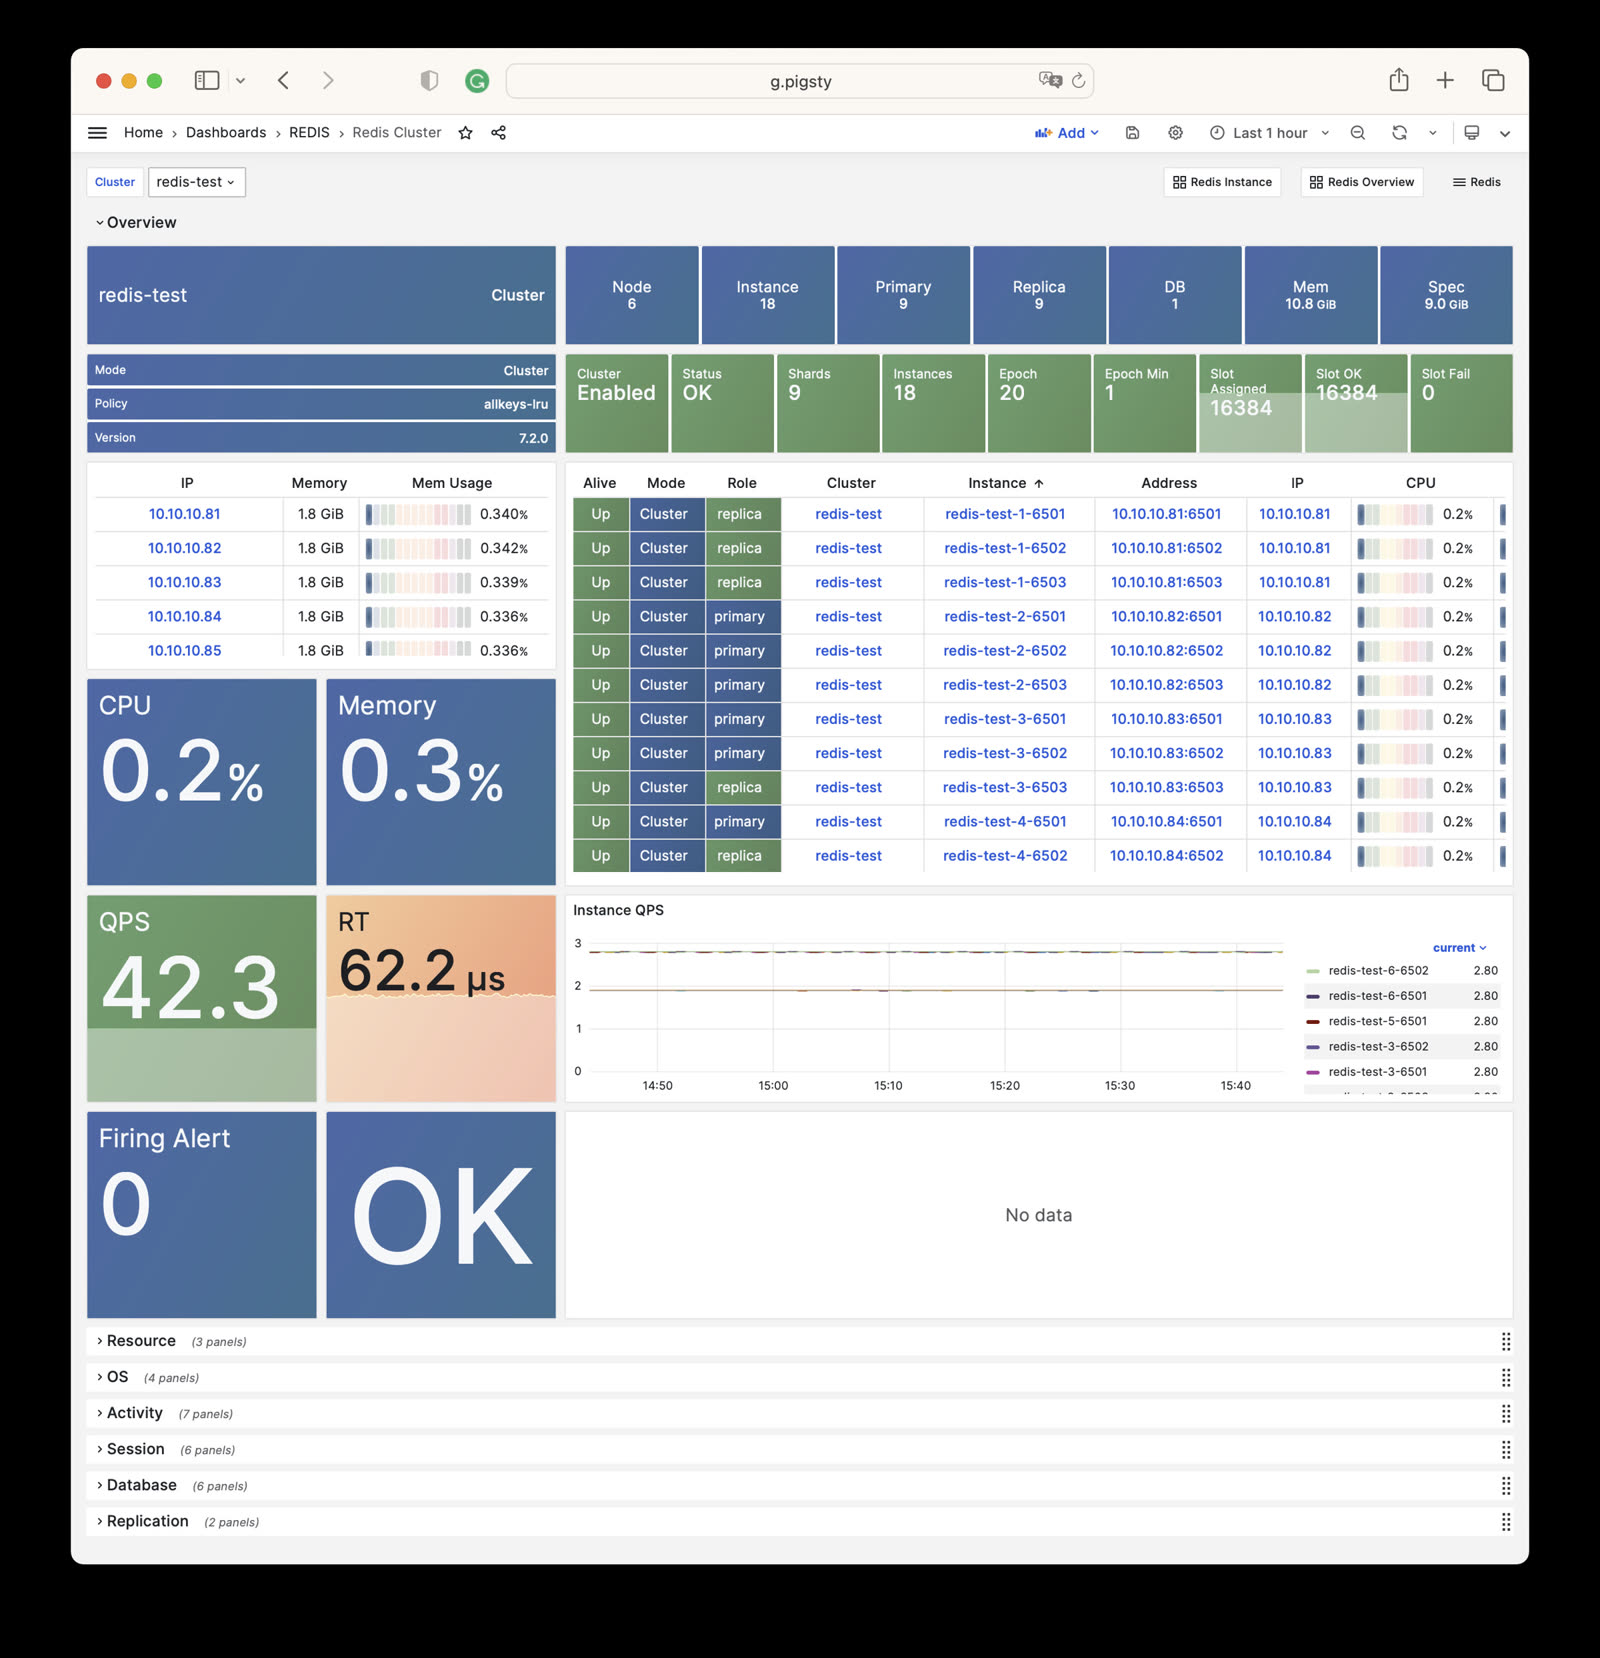
Redis Cluster: Details of a single Redis cluster
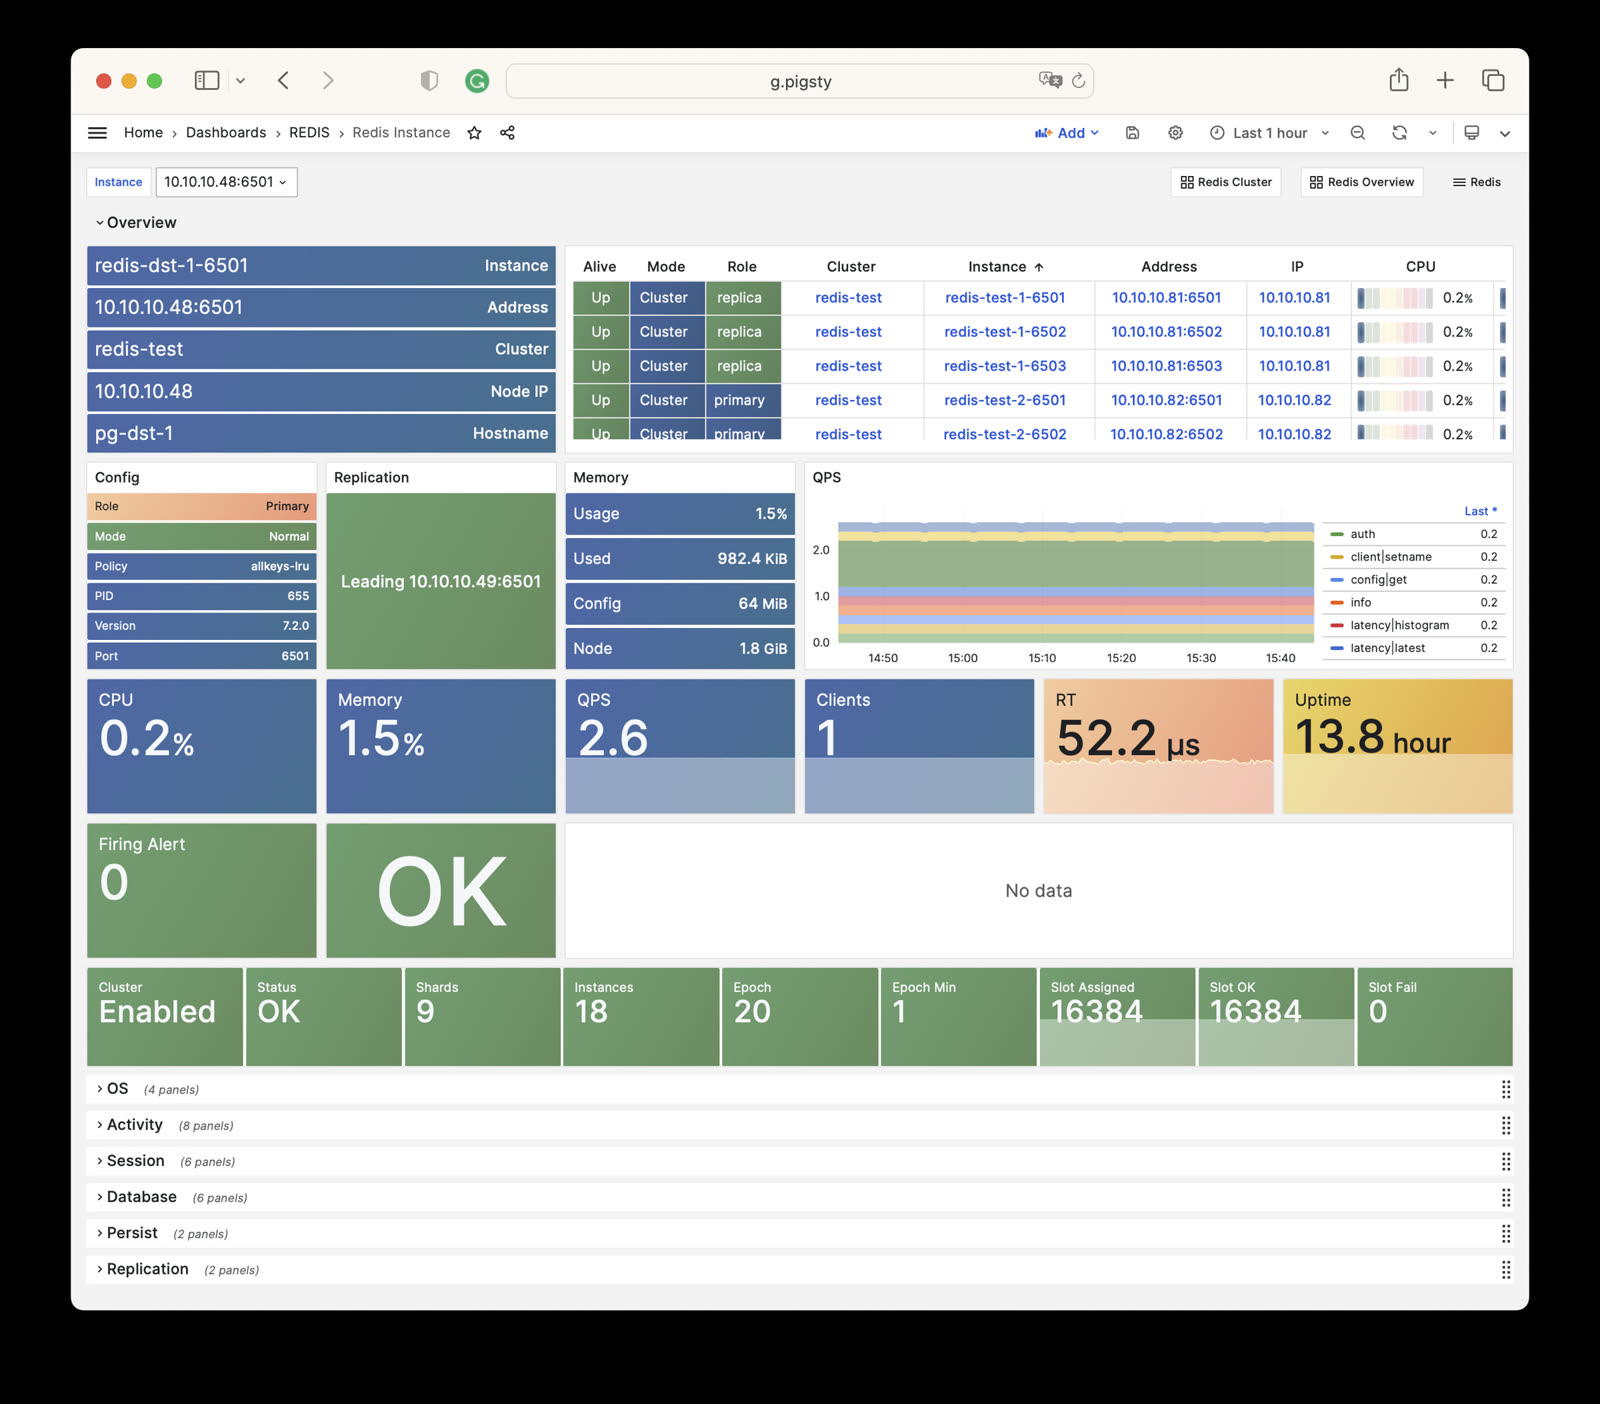
Redis Instance: Details of a single Redis instance
Monitoring
Pigsty provides three monitoring dashboards for the REDIS
Redis Overview
Redis Overview : Overview of all Redis clusters/instances
Redis Cluster
Redis Cluster : Details of a single Redis cluster
Redis Cluster Dashboard Redis Instance
Redis Instance : Details of a single Redis instance
Redis Instance Dashboard Alert Rules
Pigsty provides the following six predefined alert rules for Redis, defined in files/victoria/rules/redis.yml
RedisDown: Redis instance is downRedisRejectConn: Redis instance rejecting connectionsRedisRTHigh: Redis instance response time is too highRedisCPUHigh: Redis instance CPU usage is too highRedisMemHigh: Redis instance memory usage is too highRedisQPSHigh: Redis instance QPS is too high
The rule expr is authoritative: response time >160µs for 1 minute, CPU and memory usage >70% for 1 minute, and QPS >32000 for 5 minutes. The source excerpt below reflects the current rule file verbatim. Its CPU, memory, and QPS descriptions still contain the old 60%, 80%, and 16000 thresholds, and the RedisRTHigh comment incorrectly names pg:ins:query_rt; these comments do not change the actual expressions.
#==============================================================#
# Error #
#==============================================================#
# redis down triggers a P0 alert
- alert : RedisDown
expr : redis_up < 1
for : 1m
labels : { level : 0, severity : CRIT, category : redis }
annotations :
summary : "CRIT RedisDown: {{ $labels.ins }} {{ $labels.instance }} {{ $value }}"
description : |
redis_up[ins={{ $labels.ins }}, instance={{ $labels.instance }}] = {{ $value }} == 0
/ui/d/redis-instance?from=now-5m&to=now&var-ins={{$labels.ins}}
# redis reject connection in last 5m
- alert : RedisRejectConn
expr : redis:ins:conn_reject > 0
labels : { level : 0, severity : CRIT, category : redis }
annotations :
summary : "CRIT RedisRejectConn: {{ $labels.ins }} {{ $labels.instance }} {{ $value }}"
description : |
redis:ins:conn_reject[cls={{ $labels.cls }}, ins={{ $labels.ins }}][5m] = {{ $value }} > 0
/ui/d/redis-instance?from=now-10m&to=now&viewPanel=88&fullscreen&var-ins={{ $labels.ins }}
#==============================================================#
# Latency #
#==============================================================#
# redis avg query response time > 160 µs
- alert : RedisRTHigh
expr : redis:ins:rt > 0.00016
for : 1m
labels : { level : 1, severity : WARN, category : redis }
annotations :
summary : "WARN RedisRTHigh: {{ $labels.cls }} {{ $labels.ins }}"
description : |
pg:ins:query_rt[cls={{ $labels.cls }}, ins={{ $labels.ins }}] = {{ $value }} > 160µs
/ui/d/redis-instance?from=now-10m&to=now&viewPanel=97&fullscreen&var-ins={{ $labels.ins }}
#==============================================================#
# Saturation #
#==============================================================#
# redis cpu usage more than 70% for 1m
- alert : RedisCPUHigh
expr : redis:ins:cpu_usage > 0.70
for : 1m
labels : { level : 1, severity : WARN, category : redis }
annotations :
summary : "WARN RedisCPUHigh: {{ $labels.cls }} {{ $labels.ins }}"
description : |
redis:ins:cpu_all[cls={{ $labels.cls }}, ins={{ $labels.ins }}] = {{ $value }} > 60%
/ui/d/redis-instance?from=now-10m&to=now&viewPanel=43&fullscreen&var-ins={{ $labels.ins }}
# redis mem usage more than 70% for 1m
- alert : RedisMemHigh
expr : redis:ins:mem_usage > 0.70
for : 1m
labels : { level : 1, severity : WARN, category : redis }
annotations :
summary : "WARN RedisMemHigh: {{ $labels.cls }} {{ $labels.ins }}"
description : |
redis:ins:mem_usage[cls={{ $labels.cls }}, ins={{ $labels.ins }}] = {{ $value }} > 80%
/ui/d/redis-instance?from=now-10m&to=now&viewPanel=7&fullscreen&var-ins={{ $labels.ins }}
#==============================================================#
# Traffic #
#==============================================================#
# redis qps more than 32000 for 5m
- alert : RedisQPSHigh
expr : redis:ins:qps > 32000
for : 5m
labels : { level : 2, severity : INFO, category : redis }
annotations :
summary : "INFO RedisQPSHigh: {{ $labels.cls }} {{ $labels.ins }}"
description : |
redis:ins:qps[cls={{ $labels.cls }}, ins={{ $labels.ins }}] = {{ $value }} > 16000
/ui/d/redis-instance?from=now-10m&to=now&viewPanel=96&fullscreen&var-ins={{ $labels.ins }}