This document introduces Pigsty’s monitoring system architecture, including metrics, logs, and target management. It also covers how to monitor existing PG clusters and remote RDS services.
Monitoring Overview
Pigsty uses a modern observability stack for PostgreSQL monitoring:
Grafana for metrics visualization and PostgreSQL datasource
VictoriaMetrics for collecting metrics from PostgreSQL / Pgbouncer / Patroni / HAProxy / Node
VictoriaLogs for logging PostgreSQL / Pgbouncer / Patroni / pgBackRest and host component logs
Battery-included Grafana dashboards showcasing all aspects of PostgreSQL; use the live demo and the dashboard links in this page because the set evolves with each release
Pigsty uses three identity labels: cls, ins, ip, which are attached to all metrics and logs. Additionally, metrics from Pgbouncer, host nodes (NODE), and load balancers are also used by Pigsty, with the same labels used whenever possible for correlation analysis.
PostgreSQL-related logs are collected by Vector and sent to the VictoriaLogs log storage/query service on infra nodes.
pg_log_dir: postgres log directory, defaults to /pg/log/postgres
pgbouncer_log_dir: pgbouncer log directory, defaults to /pg/log/pgbouncer
patroni_log_dir: patroni log directory, defaults to /pg/log/patroni
pgbackrest_log_dir: pgbackrest log directory, defaults to /pg/log/pgbackrest
Target Management
VictoriaMetrics monitoring targets are defined in static files under /infra/targets/pgsql/, with each instance having a corresponding file. Taking pg-meta-1 as an example:
# pg-meta-1 [primary] @ 10.10.10.10- labels:{cls:pg-meta, ins:pg-meta-1, ip:10.10.10.10}targets:- 10.10.10.10:9630# <--- pg_exporter for PostgreSQL metrics- 10.10.10.10:9631# <--- pgbouncer_exporter for PgBouncer metrics- 10.10.10.10:8008# <--- Patroni metrics (when API SSL is not enabled)- 10.10.10.10:9854# <--- pgbackrest_exporter for backup metrics
When the global flag patroni_ssl_enabled is set, Patroni targets are written separately to /infra/targets/patroni/<ins>.yml, because they use an HTTPS scrape endpoint. When monitoring RDS instances, monitoring targets are placed in /infra/targets/pgrds/ and managed by cluster.
When removing a cluster using bin/pgsql-rm or pgsql-rm.yml, the corresponding monitoring targets are removed. You can also use:
bin/pgmon-rm <cls|ins> # Remove monitoring targets from all infra nodes
Remote RDS monitoring targets are placed in /infra/targets/pgrds/<cls>.yml, created by the pgsql-monitor.yml playbook or bin/pgmon-add script.
Monitoring Modes
Pigsty provides three monitoring modes to suit different monitoring needs.
Databases fully managed by Pigsty are automatically monitored with the best support and typically require no configuration. For existing PostgreSQL clusters or RDS services, if the target DB nodes can be managed by Pigsty (ssh accessible, sudo available), you can consider managed deployment for a monitoring experience similar to native Pigsty. If you can only access the target database via PGURL (database connection string), such as remote RDS services, you can use basic mode to monitor the target database.
Monitor Existing Cluster
If the target DB nodes can be managed by Pigsty (ssh accessible and sudo available), you can use the pg_exporter task in the pgsql.yml playbook to deploy monitoring components (PG Exporter) on target nodes in the same way as standard deployments. You can also use the pgbouncer and pgbouncer_exporter tasks from that playbook to deploy connection pools and their monitoring on existing instance nodes. Additionally, you can use node_exporter, haproxy, and vector from node.yml to deploy host monitoring, load balancing, and log collection components, achieving an experience identical to native Pigsty database instances.
The definition method for existing clusters is exactly the same as for clusters managed by Pigsty. You selectively execute partial tasks from the pgsql.yml playbook instead of running the entire playbook.
./node.yml -l <cls> -t node_repo,node_pkg # Add YUM repos from INFRA nodes and install packages on host nodes./node.yml -l <cls> -t node_exporter,node_register # Configure host monitoring and add to VictoriaMetrics./node.yml -l <cls> -t vector # Configure host log collection and send to VictoriaLogs./pgsql.yml -l <cls> -t pg_exporter,pg_register # Configure PostgreSQL monitoring and register with VictoriaMetrics/Grafana
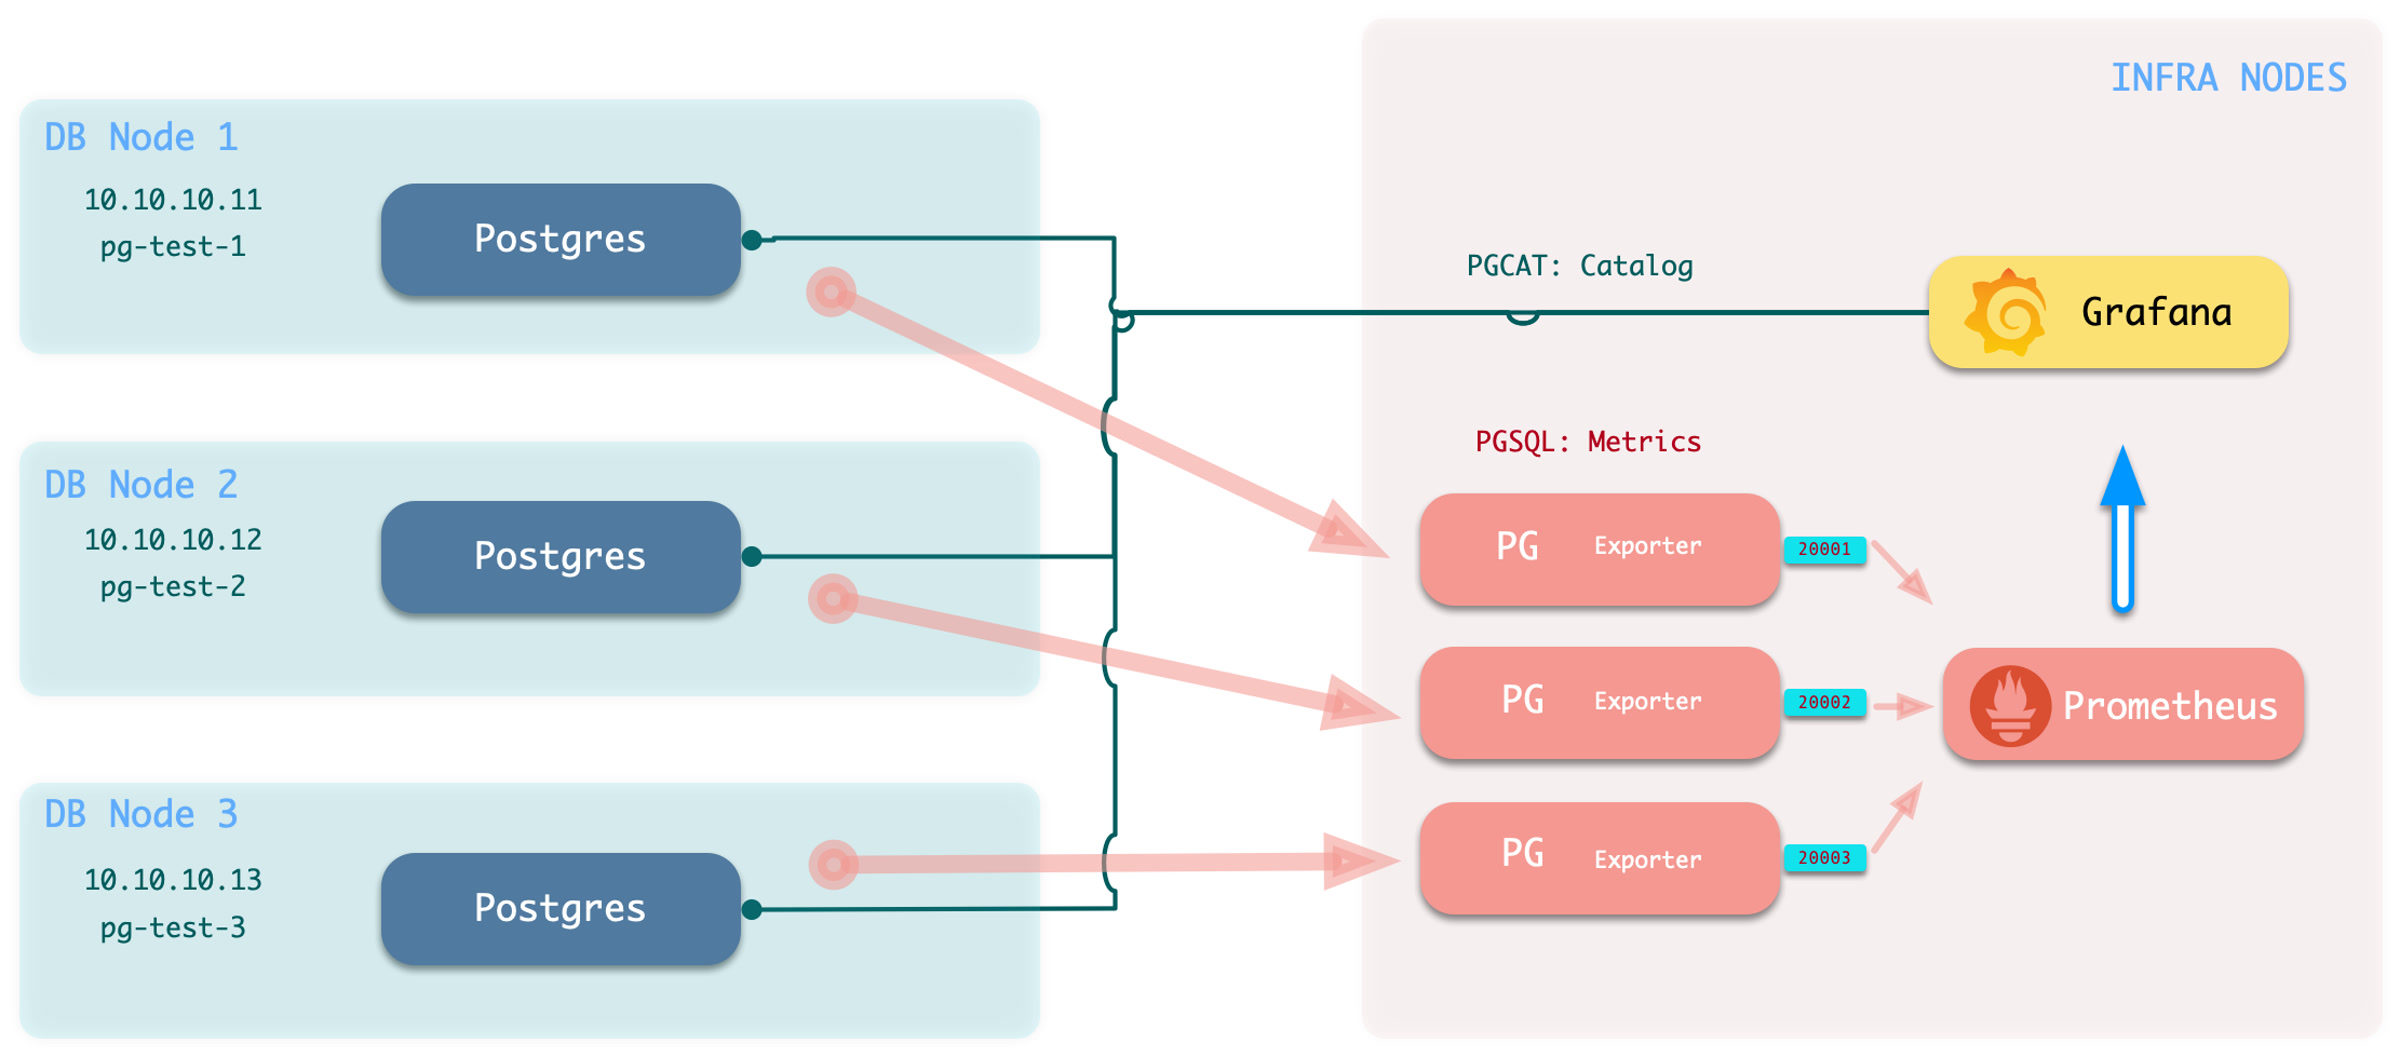
If you can only access the target database via PGURL (database connection string), you can configure according to the instructions here. In this mode, Pigsty deploys corresponding PG Exporters on INFRA nodes to scrape remote database metrics, as shown below:
In this mode, the monitoring system will not have metrics from hosts, connection pools, load balancers, or high availability components, but the database itself and real-time status information from the data catalog are still available. Pigsty provides two dedicated monitoring dashboards focused on PostgreSQL metrics: PGRDS Cluster and PGRDS Instance, while overview and database-level monitoring reuses existing dashboards. Since Pigsty cannot manage your RDS, users need to configure monitoring objects on the target database in advance.
Limitations when monitoring external Postgres instances
PgBouncer connection pool metrics are not available
Patroni high availability component metrics are not available
Host node monitoring metrics are not available, including node HAProxy and Keepalived metrics
Log collection and log-derived metrics are not available
Here we use the sandbox environment as an example: suppose the pg-meta cluster is an RDS instance pg-foo-1 to be monitored, and the pg-test cluster is an RDS cluster pg-bar to be monitored:
Create monitoring schemas, users, and permissions on the target. Refer to Monitor Setup for details
Declare the cluster in the configuration inventory. For example, if we want to monitor “remote” pg-meta & pg-test clusters:
infra:# Infra cluster for proxies, monitoring, alerts, etc.hosts:{10.10.10.10:{infra_seq:1}}vars:# Install pg_exporter on group 'infra' for remote postgres RDSpg_exporters:# List all remote instances here, assign a unique unused local port for k20001:{pg_cluster:pg-foo, pg_seq:1, pg_host:10.10.10.10 , pg_databases:[{name:meta }] }# Register meta database as Grafana datasource20002:{pg_cluster:pg-bar, pg_seq:1, pg_host:10.10.10.11 , pg_port:5432}# Different connection string methods20003:{pg_cluster:pg-bar, pg_seq:2, pg_host:10.10.10.12 , pg_exporter_url:'postgres://dbuser_monitor:[email protected]:5432/postgres?sslmode=disable'}20004:{pg_cluster:pg-bar, pg_seq:3, pg_host:10.10.10.13 , pg_monitor_username:dbuser_monitor, pg_monitor_password:DBUser.Monitor }
Databases listed in the pg_databases field will be registered in Grafana as PostgreSQL datasources, providing data support for PGCAT monitoring dashboards. If you don’t want to use PGCAT and register databases in Grafana, simply set pg_databases to an empty array or leave it blank.
Execute the add monitoring command: bin/pgmon-add <clsname>
bin/pgmon-add pg-foo # Bring pg-foo cluster into monitoringbin/pgmon-add pg-bar # Bring pg-bar cluster into monitoring
To remove remote cluster monitoring targets, use bin/pgmon-rm <clsname>
bin/pgmon-rm pg-foo # Remove pg-foo from Pigsty monitoringbin/pgmon-rm pg-bar # Remove pg-bar from Pigsty monitoring
You can use more parameters to override default pg_exporter options. Here’s an example configuration for monitoring Aliyun RDS for PostgreSQL and PolarDB with Pigsty:
Example: Monitoring Aliyun RDS for PostgreSQL and PolarDB
infra:# Infra cluster for proxies, monitoring, alerts, etc.hosts:{10.10.10.10:{infra_seq:1}}vars:pg_exporters:# List all remote RDS PG instances to be monitored here20001:# Assign a unique unused local port for local monitoring agent, this is a PolarDB primarypg_cluster:pg-polar # RDS cluster name (identity parameter, manually assigned name in monitoring system)pg_seq:1# RDS instance number (identity parameter, manually assigned name in monitoring system)pg_host:pc-2ze379wb1d4irc18x.polardbpg.rds.aliyuncs.com# RDS host addresspg_port:1921# RDS port (from console connection info)pg_exporter_auto_discovery:true# Enable new database auto-discoverypg_exporter_include_database:'test'# Only monitor databases in this list (comma-separated)pg_monitor_username:dbuser_monitor # Monitoring username, overrides global configpg_monitor_password:DBUser_Monitor # Monitoring password, overrides global configpg_databases:[{name:test }] # List of databases to enable PGCAT for, only name field needed, set register_datasource to false to not register20002:# This is a PolarDB standbypg_cluster:pg-polar # RDS cluster name (identity parameter, manually assigned name in monitoring system)pg_seq:2# RDS instance number (identity parameter, manually assigned name in monitoring system)pg_host:pe-2ze7tg620e317ufj4.polarpgmxs.rds.aliyuncs.com# RDS host addresspg_port:1521# RDS port (from console connection info)pg_exporter_auto_discovery:true# Enable new database auto-discoverypg_exporter_include_database:'test,postgres'# Only monitor databases in this list (comma-separated)pg_monitor_username:dbuser_monitor # Monitoring usernamepg_monitor_password:DBUser_Monitor # Monitoring passwordpg_databases:[{name:test } ] # List of databases to enable PGCAT for, only name field needed, set register_datasource to false to not register20004:# This is a basic single-node RDS for PostgreSQL instancepg_cluster:pg-rds # RDS cluster name (identity parameter, manually assigned name in monitoring system)pg_seq:1# RDS instance number (identity parameter, manually assigned name in monitoring system)pg_host:pgm-2zern3d323fe9ewk.pg.rds.aliyuncs.com # RDS host addresspg_port:5432# RDS port (from console connection info)pg_exporter_auto_discovery:true# Enable new database auto-discoverypg_exporter_include_database:'rds'# Only monitor databases in this list (comma-separated)pg_monitor_username:dbuser_monitor # Monitoring usernamepg_monitor_password:DBUser_Monitor # Monitoring passwordpg_databases:[{name:rds } ] # List of databases to enable PGCAT for, only name field needed, set register_datasource to false to not register20005:# This is a high-availability RDS for PostgreSQL cluster primarypg_cluster:pg-rdsha # RDS cluster name (identity parameter, manually assigned name in monitoring system)pg_seq:1# RDS instance number (identity parameter, manually assigned name in monitoring system)pg_host:pgm-2ze3d35d27bq08wu.pg.rds.aliyuncs.com # RDS host addresspg_port:5432# RDS port (from console connection info)pg_exporter_include_database:'rds'# Only monitor databases in this list (comma-separated)pg_databases:[{name:rds }, {name : test} ] # Include these two databases in PGCAT management, register as Grafana datasources20006:# This is a high-availability RDS for PostgreSQL cluster read-only instance (standby)pg_cluster:pg-rdsha # RDS cluster name (identity parameter, manually assigned name in monitoring system)pg_seq:2# RDS instance number (identity parameter, manually assigned name in monitoring system)pg_host:pgr-2zexqxalk7d37edt.pg.rds.aliyuncs.com # RDS host addresspg_port:5432# RDS port (from console connection info)pg_exporter_include_database:'rds'# Only monitor databases in this list (comma-separated)pg_databases:[{name:rds }, {name : test} ] # Include these two databases in PGCAT management, register as Grafana datasources
Monitor Setup
When you want to monitor existing instances, whether RDS or self-built PostgreSQL instances, you need to configure the target database so that Pigsty can access them.
To monitor an external existing PostgreSQL instance, you need a connection string that can access that instance/cluster. Any accessible connection string (business user, superuser) can be used, but we recommend using a dedicated monitoring user to avoid permission leaks.
Monitor User: The default username is dbuser_monitor, which should belong to the pg_monitor role group or have access to relevant views
Monitor Authentication: Default password authentication is used; ensure HBA policies allow the monitoring user to access databases from the admin node or DB node locally
Monitor Schema: Fixed schema name monitor is used for installing additional monitoring views and extension plugins; optional but recommended
Monitor Extension: Strongly recommended to enable the built-in monitoring extension pg_stat_statements
Monitor Views: Monitoring views are optional but can provide additional metric support
Monitor User
Using the default monitoring user dbuser_monitor as an example, create the following user on the target database cluster.
CREATEUSERdbuser_monitor;-- Create monitoring user
COMMENTONROLEdbuser_monitorIS'system monitor user';-- Comment on monitoring user
GRANTpg_monitorTOdbuser_monitor;-- Grant pg_monitor privilege to monitoring user, otherwise some metrics cannot be collected
ALTERUSERdbuser_monitorPASSWORD'DBUser.Monitor';-- Modify monitoring user password as needed (strongly recommended! but keep consistent with Pigsty config)
ALTERUSERdbuser_monitorSETlog_min_duration_statement=1000;-- Recommended to avoid logs filling up with monitoring slow queries
ALTERUSERdbuser_monitorSETsearch_path=monitor,public;-- Recommended to ensure pg_stat_statements extension works properly
Configure the database pg_hba.conf file, adding the following rules to allow the monitoring user to access all databases from localhost and the admin machine using password authentication.
# allow local role monitor with passwordlocal all dbuser_monitor md5host all dbuser_monitor 127.0.0.1/32 md5host all dbuser_monitor <admin_machine_IP>/32 md5
If your RDS doesn’t support defining HBA, simply whitelist the internal IP address of the machine running Pigsty.
Monitor Schema
The monitoring schema is optional; even without it, the main functionality of Pigsty’s monitoring system can work properly, but we strongly recommend creating this schema.
CREATESCHEMAIFNOTEXISTSmonitor;-- Create dedicated monitoring schema
GRANTUSAGEONSCHEMAmonitorTOdbuser_monitor;-- Allow monitoring user to use it
Monitor Extension
The monitoring extension is optional, but we strongly recommend enabling the pg_stat_statements extension, which provides important data about query performance.
Note: This extension must be listed in the database parameter shared_preload_libraries to take effect, and modifying that parameter requires a database restart.
Please note that you should install this extension in the default admin database postgres. Sometimes RDS doesn’t allow you to create a monitoring schema in the postgres database. In such cases, you can install the pg_stat_statements plugin in the default public schema, as long as you ensure the monitoring user’s search_path is configured as above so it can find the pg_stat_statements view.
CREATEEXTENSIONIFNOTEXISTS"pg_stat_statements";ALTERUSERdbuser_monitorSETsearch_path=monitor,public;-- Recommended to ensure pg_stat_statements extension works properly
Monitor Views
Monitoring views provide several commonly used pre-processed results and encapsulate permissions for monitoring metrics that require high privileges (such as shared memory allocation), making them convenient for querying and use. Strongly recommended to create in all databases requiring monitoring.
Monitoring schema and monitoring view definitions
The SQL below is provided to explain the monitored objects. The complete definitions rendered by current Pigsty are authoritative in roles/pgsql/templates/pg-init-template.sql, which also includes additional hardening for secure search paths and privilege boundaries.
----------------------------------------------------------------------
-- Table bloat estimate : monitor.pg_table_bloat
----------------------------------------------------------------------
DROPVIEWIFEXISTSmonitor.pg_table_bloatCASCADE;CREATEORREPLACEVIEWmonitor.pg_table_bloatASSELECTCURRENT_CATALOGASdatname,nspname,relname,tblid,bs*tblpagesASsize,CASEWHENtblpages-est_tblpages_ff>0THEN(tblpages-est_tblpages_ff)/tblpages::FLOATELSE0ENDASratioFROM(SELECTceil(reltuples/((bs-page_hdr)*fillfactor/(tpl_size*100)))+ceil(toasttuples/4)ASest_tblpages_ff,tblpages,fillfactor,bs,tblid,nspname,relname,is_naFROM(SELECT(4+tpl_hdr_size+tpl_data_size+(2*ma)-CASEWHENtpl_hdr_size%ma=0THENmaELSEtpl_hdr_size%maEND-CASEWHENceil(tpl_data_size)::INT%ma=0THENmaELSEceil(tpl_data_size)::INT%maEND)AStpl_size,(heappages+toastpages)AStblpages,heappages,toastpages,reltuples,toasttuples,bs,page_hdr,tblid,nspname,relname,fillfactor,is_naFROM(SELECTtbl.oidAStblid,ns.nspname,tbl.relname,tbl.reltuples,tbl.relpagesASheappages,coalesce(toast.relpages,0)AStoastpages,coalesce(toast.reltuples,0)AStoasttuples,coalesce(substring(array_to_string(tbl.reloptions,' ')FROM'fillfactor=([0-9]+)')::smallint,100)ASfillfactor,current_setting('block_size')::numericASbs,CASEWHENversion()~'mingw32'ORversion()~'64-bit|x86_64|ppc64|ia64|amd64'THEN8ELSE4ENDASma,24ASpage_hdr,23+CASEWHENMAX(coalesce(s.null_frac,0))>0THEN(7+count(s.attname))/8ELSE0::intEND+CASEWHENbool_or(att.attname='oid'andatt.attnum<0)THEN4ELSE0ENDAStpl_hdr_size,sum((1-coalesce(s.null_frac,0))*coalesce(s.avg_width,0))AStpl_data_size,bool_or(att.atttypid='pg_catalog.name'::regtype)ORsum(CASEWHENatt.attnum>0THEN1ELSE0END)<>count(s.attname)ASis_naFROMpg_attributeASattJOINpg_classAStblONatt.attrelid=tbl.oidJOINpg_namespaceASnsONns.oid=tbl.relnamespaceLEFTJOINpg_statsASsONs.schemaname=ns.nspnameANDs.tablename=tbl.relnameANDs.inherited=falseANDs.attname=att.attnameLEFTJOINpg_classAStoastONtbl.reltoastrelid=toast.oidWHERENOTatt.attisdroppedANDtbl.relkind='r'ANDnspnameNOTIN('pg_catalog','information_schema')GROUPBY1,2,3,4,5,6,7,8,9,10)ASs)ASs2)ASs3WHERENOTis_na;COMMENTONVIEWmonitor.pg_table_bloatIS'postgres table bloat estimate';GRANTSELECTONmonitor.pg_table_bloatTOpg_monitor;----------------------------------------------------------------------
-- Index bloat estimate : monitor.pg_index_bloat
----------------------------------------------------------------------
DROPVIEWIFEXISTSmonitor.pg_index_bloatCASCADE;CREATEORREPLACEVIEWmonitor.pg_index_bloatASSELECTCURRENT_CATALOGASdatname,nspname,idxnameASrelname,tblid,idxid,relpages::BIGINT*bsASsize,COALESCE((relpages-(reltuples*(6+ma-(CASEWHENindex_tuple_hdr%ma=0THENmaELSEindex_tuple_hdr%maEND)+nulldatawidth+ma-(CASEWHENnulldatawidth%ma=0THENmaELSEnulldatawidth%maEND))/(bs-pagehdr)::FLOAT+1)),0)/relpages::FLOATASratioFROM(SELECTnspname,idxname,indrelidAStblid,indexrelidASidxid,reltuples,relpages,current_setting('block_size')::INTEGERASbs,(CASEWHENversion()~'mingw32'ORversion()~'64-bit|x86_64|ppc64|ia64|amd64'THEN8ELSE4END)ASma,24ASpagehdr,(CASEWHENmax(COALESCE(pg_stats.null_frac,0))=0THEN2ELSE6END)ASindex_tuple_hdr,sum((1.0-COALESCE(pg_stats.null_frac,0.0))*COALESCE(pg_stats.avg_width,1024))::INTEGERASnulldatawidthFROMpg_attributeJOIN(SELECTpg_namespace.nspname,ic.relnameASidxname,ic.reltuples,ic.relpages,pg_index.indrelid,pg_index.indexrelid,tc.relnameAStablename,regexp_split_to_table(pg_index.indkey::TEXT,' ')::INTEGERASattnum,pg_index.indexrelidASindex_oidFROMpg_indexJOINpg_classicONpg_index.indexrelid=ic.oidJOINpg_classtcONpg_index.indrelid=tc.oidJOINpg_namespaceONpg_namespace.oid=ic.relnamespaceJOINpg_amONic.relam=pg_am.oidWHEREpg_am.amname='btree'ANDic.relpages>0ANDnspnameNOTIN('pg_catalog','information_schema'))ind_attsONpg_attribute.attrelid=ind_atts.indexrelidANDpg_attribute.attnum=ind_atts.attnumJOINpg_statsONpg_stats.schemaname=ind_atts.nspnameAND((pg_stats.tablename=ind_atts.tablenameANDpg_stats.attname=pg_get_indexdef(pg_attribute.attrelid,pg_attribute.attnum,TRUE))OR(pg_stats.tablename=ind_atts.idxnameANDpg_stats.attname=pg_attribute.attname))WHEREpg_attribute.attnum>0GROUPBY1,2,3,4,5,6)est;COMMENTONVIEWmonitor.pg_index_bloatIS'postgres index bloat estimate (btree-only)';GRANTSELECTONmonitor.pg_index_bloatTOpg_monitor;----------------------------------------------------------------------
-- Relation Bloat : monitor.pg_bloat
----------------------------------------------------------------------
DROPVIEWIFEXISTSmonitor.pg_bloatCASCADE;CREATEORREPLACEVIEWmonitor.pg_bloatASSELECTcoalesce(ib.datname,tb.datname)ASdatname,coalesce(ib.nspname,tb.nspname)ASnspname,coalesce(ib.tblid,tb.tblid)AStblid,coalesce(tb.nspname||'.'||tb.relname,ib.nspname||'.'||ib.tblid::RegClass)AStblname,tb.sizeAStbl_size,CASEWHENtb.ratio<0THEN0ELSEround(tb.ratio::NUMERIC,6)ENDAStbl_ratio,(tb.size*(CASEWHENtb.ratio<0THEN0ELSEtb.ratio::NUMERICEND))::BIGINTAStbl_wasted,ib.idxid,ib.nspname||'.'||ib.relnameASidxname,ib.sizeASidx_size,CASEWHENib.ratio<0THEN0ELSEround(ib.ratio::NUMERIC,5)ENDASidx_ratio,(ib.size*(CASEWHENib.ratio<0THEN0ELSEib.ratio::NUMERICEND))::BIGINTASidx_wastedFROMmonitor.pg_index_bloatibFULLOUTERJOINmonitor.pg_table_bloattbONib.tblid=tb.tblid;COMMENTONVIEWmonitor.pg_bloatIS'postgres relation bloat detail';GRANTSELECTONmonitor.pg_bloatTOpg_monitor;----------------------------------------------------------------------
-- monitor.pg_index_bloat_human
----------------------------------------------------------------------
DROPVIEWIFEXISTSmonitor.pg_index_bloat_humanCASCADE;CREATEORREPLACEVIEWmonitor.pg_index_bloat_humanASSELECTidxnameASname,tblname,idx_wastedASwasted,pg_size_pretty(idx_size)ASidx_size,round(100*idx_ratio::NUMERIC,2)ASidx_ratio,pg_size_pretty(idx_wasted)ASidx_wasted,pg_size_pretty(tbl_size)AStbl_size,round(100*tbl_ratio::NUMERIC,2)AStbl_ratio,pg_size_pretty(tbl_wasted)AStbl_wastedFROMmonitor.pg_bloatWHEREidxnameISNOTNULL;COMMENTONVIEWmonitor.pg_index_bloat_humanIS'postgres index bloat info in human-readable format';GRANTSELECTONmonitor.pg_index_bloat_humanTOpg_monitor;----------------------------------------------------------------------
-- monitor.pg_table_bloat_human
----------------------------------------------------------------------
DROPVIEWIFEXISTSmonitor.pg_table_bloat_humanCASCADE;CREATEORREPLACEVIEWmonitor.pg_table_bloat_humanASSELECTtblnameASname,idx_wasted+tbl_wastedASwasted,pg_size_pretty(idx_wasted+tbl_wasted)ASall_wasted,pg_size_pretty(tbl_wasted)AStbl_wasted,pg_size_pretty(tbl_size)AStbl_size,tbl_ratio,pg_size_pretty(idx_wasted)ASidx_wasted,pg_size_pretty(idx_size)ASidx_size,round(idx_wasted::NUMERIC*100.0/idx_size,2)ASidx_ratioFROM(SELECTdatname,nspname,tblname,coalesce(max(tbl_wasted),0)AStbl_wasted,coalesce(max(tbl_size),1)AStbl_size,round(100*coalesce(max(tbl_ratio),0)::NUMERIC,2)AStbl_ratio,coalesce(sum(idx_wasted),0)ASidx_wasted,coalesce(sum(idx_size),1)ASidx_sizeFROMmonitor.pg_bloatWHEREtblnameISNOTNULLGROUPBY1,2,3)d;COMMENTONVIEWmonitor.pg_table_bloat_humanIS'postgres table bloat info in human-readable format';GRANTSELECTONmonitor.pg_table_bloat_humanTOpg_monitor;----------------------------------------------------------------------
-- Activity Overview: monitor.pg_session
----------------------------------------------------------------------
DROPVIEWIFEXISTSmonitor.pg_sessionCASCADE;CREATEORREPLACEVIEWmonitor.pg_sessionASSELECTcoalesce(datname,'all')ASdatname,numbackends,active,idle,ixact,max_duration,max_tx_duration,max_conn_durationFROM(SELECTdatname,count(*)ASnumbackends,count(*)FILTER(WHEREstate='active')ASactive,count(*)FILTER(WHEREstate='idle')ASidle,count(*)FILTER(WHEREstate='idle in transaction'ORstate='idle in transaction (aborted)')ASixact,max(extract(epochfromnow()-state_change))FILTER(WHEREstate='active')ASmax_duration,max(extract(epochfromnow()-xact_start))ASmax_tx_duration,max(extract(epochfromnow()-backend_start))ASmax_conn_durationFROMpg_stat_activityWHEREbackend_type='client backend'ANDpid<>pg_backend_pid()GROUPBYROLLUP(1)ORDERBY1NULLSFIRST)t;COMMENTONVIEWmonitor.pg_sessionIS'postgres activity group by session';GRANTSELECTONmonitor.pg_sessionTOpg_monitor;----------------------------------------------------------------------
-- Sequential Scan: monitor.pg_seq_scan
----------------------------------------------------------------------
DROPVIEWIFEXISTSmonitor.pg_seq_scanCASCADE;CREATEORREPLACEVIEWmonitor.pg_seq_scanASSELECTschemanameASnspname,relname,seq_scan,seq_tup_read,seq_tup_read/seq_scanASseq_tup_avg,idx_scan,n_live_tup+n_dead_tupAStuples,round(n_live_tup*100.0::NUMERIC/(n_live_tup+n_dead_tup),2)ASlive_ratioFROMpg_stat_user_tablesWHEREseq_scan>0and(n_live_tup+n_dead_tup)>0ORDERBYseq_scanDESC;COMMENTONVIEWmonitor.pg_seq_scanIS'table that have seq scan';GRANTSELECTONmonitor.pg_seq_scanTOpg_monitor;
Function for viewing shared memory allocation (PG13 and above)
DROPFUNCTIONIFEXISTSmonitor.pg_shmem()CASCADE;CREATEORREPLACEFUNCTIONmonitor.pg_shmem()RETURNSSETOFpg_shmem_allocationsSETsearch_path=''AS$$SELECT*FROMpg_shmem_allocations;$$LANGUAGESQLSECURITYDEFINER;COMMENTONFUNCTIONmonitor.pg_shmem()IS'security wrapper for system view pg_shmem';REVOKEALLONFUNCTIONmonitor.pg_shmem()FROMPUBLIC;REVOKEALLONFUNCTIONmonitor.pg_shmem()FROMdbrole_readonly;REVOKEALLONFUNCTIONmonitor.pg_shmem()FROMdbrole_offline;GRANTEXECUTEONFUNCTIONmonitor.pg_shmem()TOpg_monitor;