Monitoring
Pigsty currently provides 10 monitoring dashboards in the NODE dashboard directory, along with comprehensive alerting rules.
Dashboards
The NODE dashboard directory currently contains 10 dashboards. The JuiceFS and Claude Code dashboards show data only after those components are deployed and emit metrics.
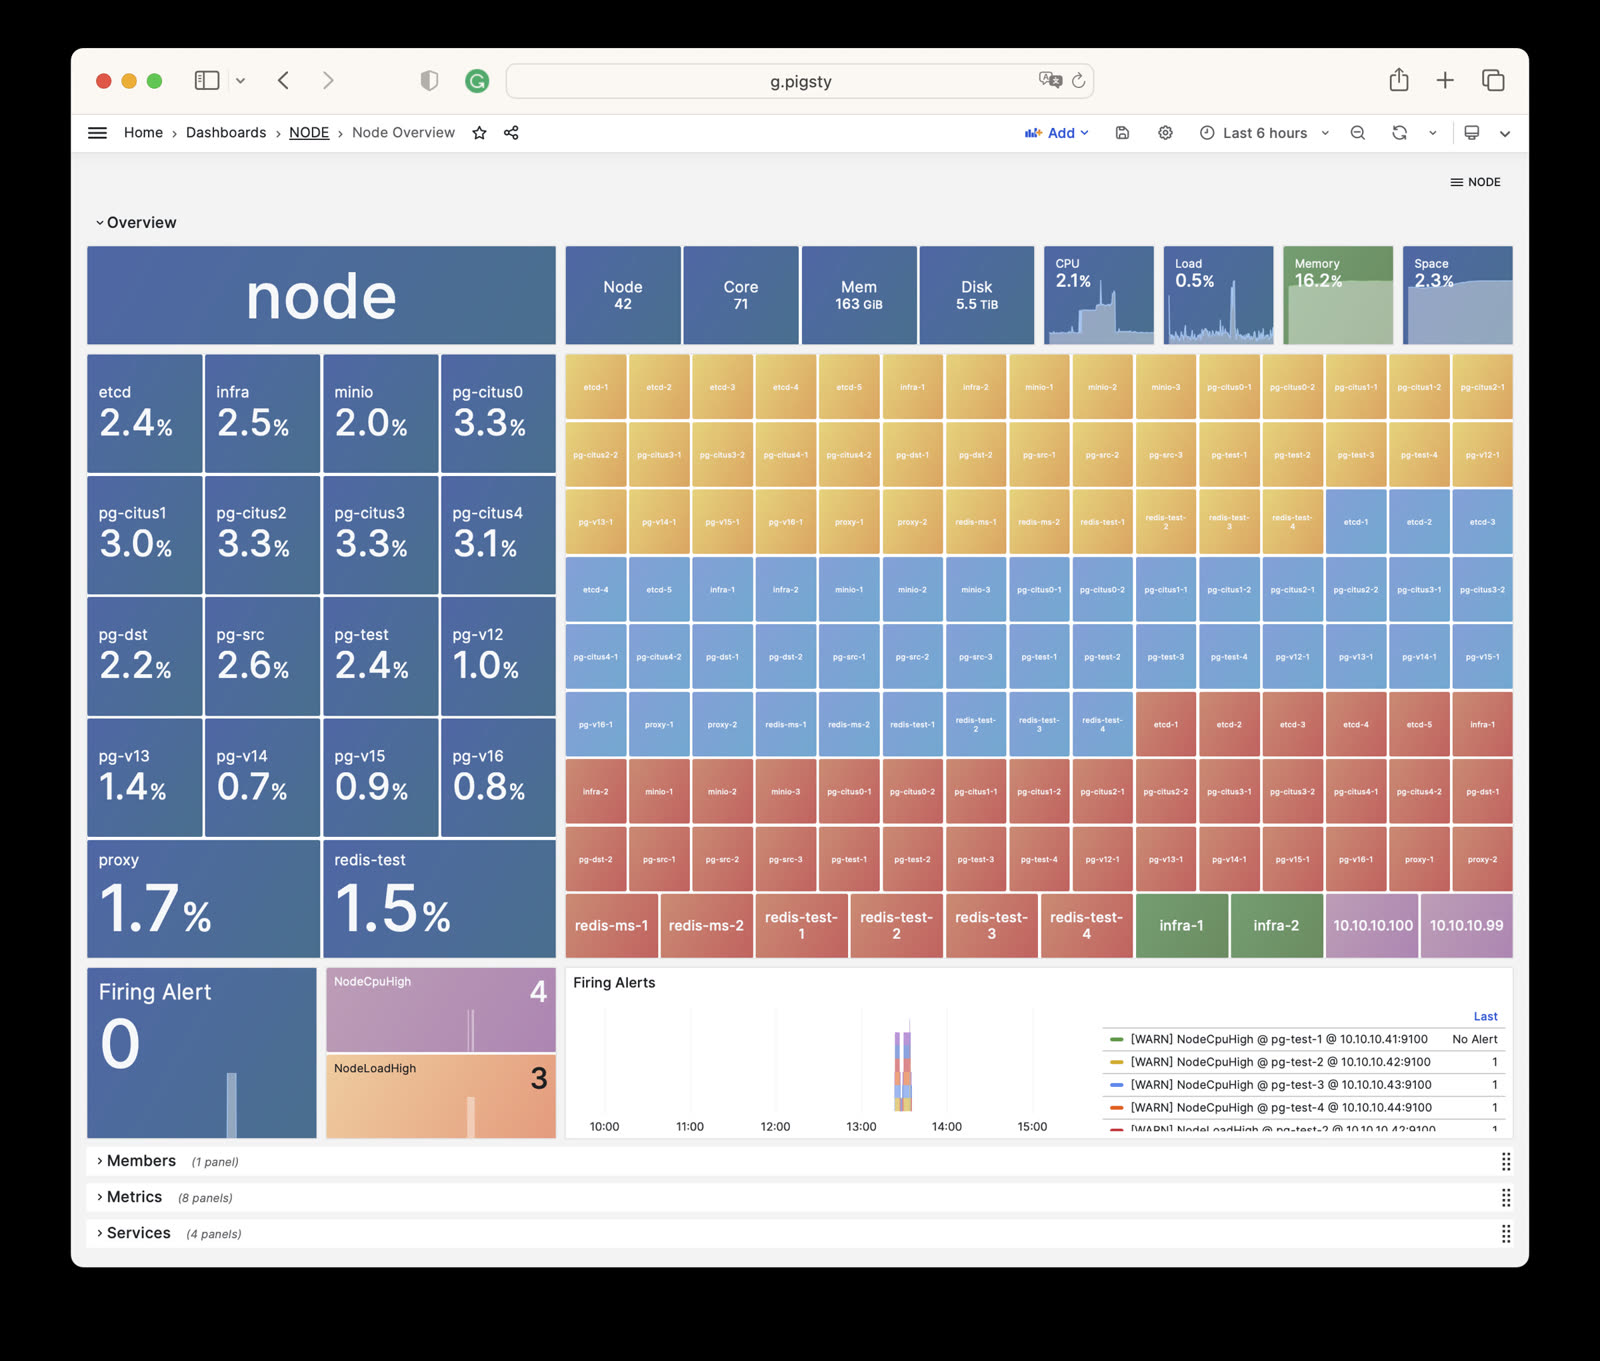
NODE Overview
Displays an overall overview of all host nodes in the current environment.
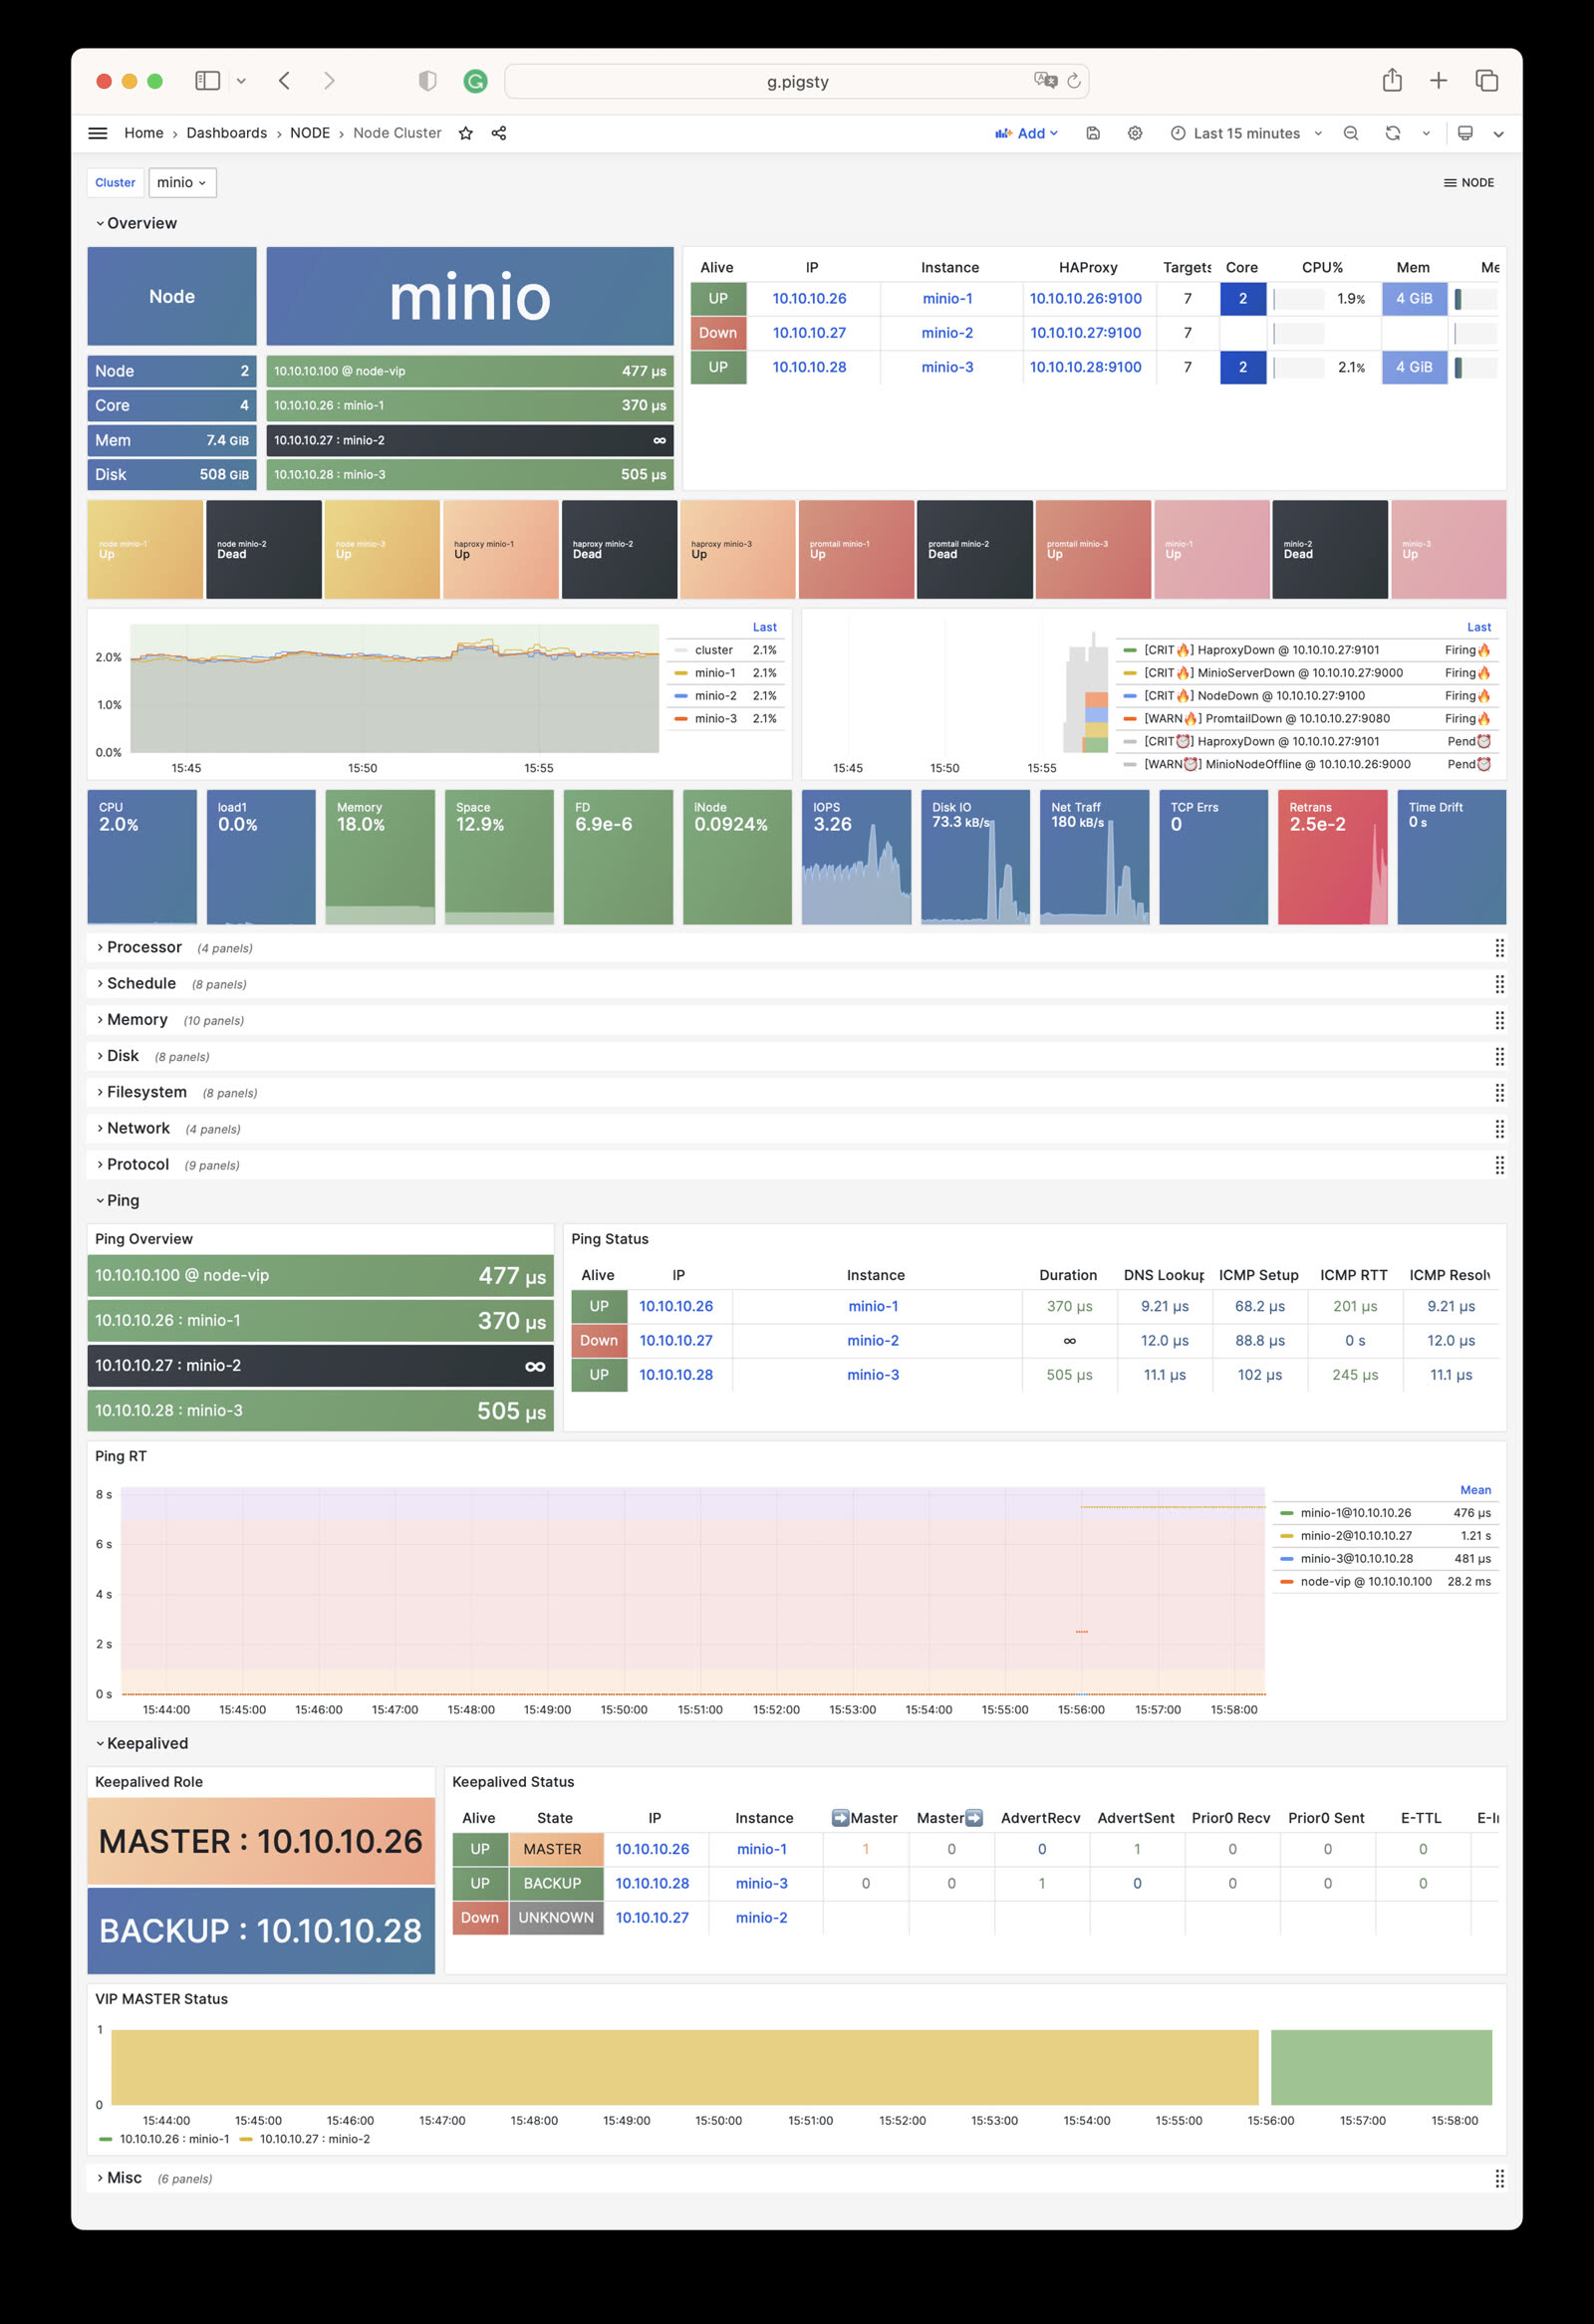
NODE Cluster
Shows detailed monitoring data for a specific host cluster.
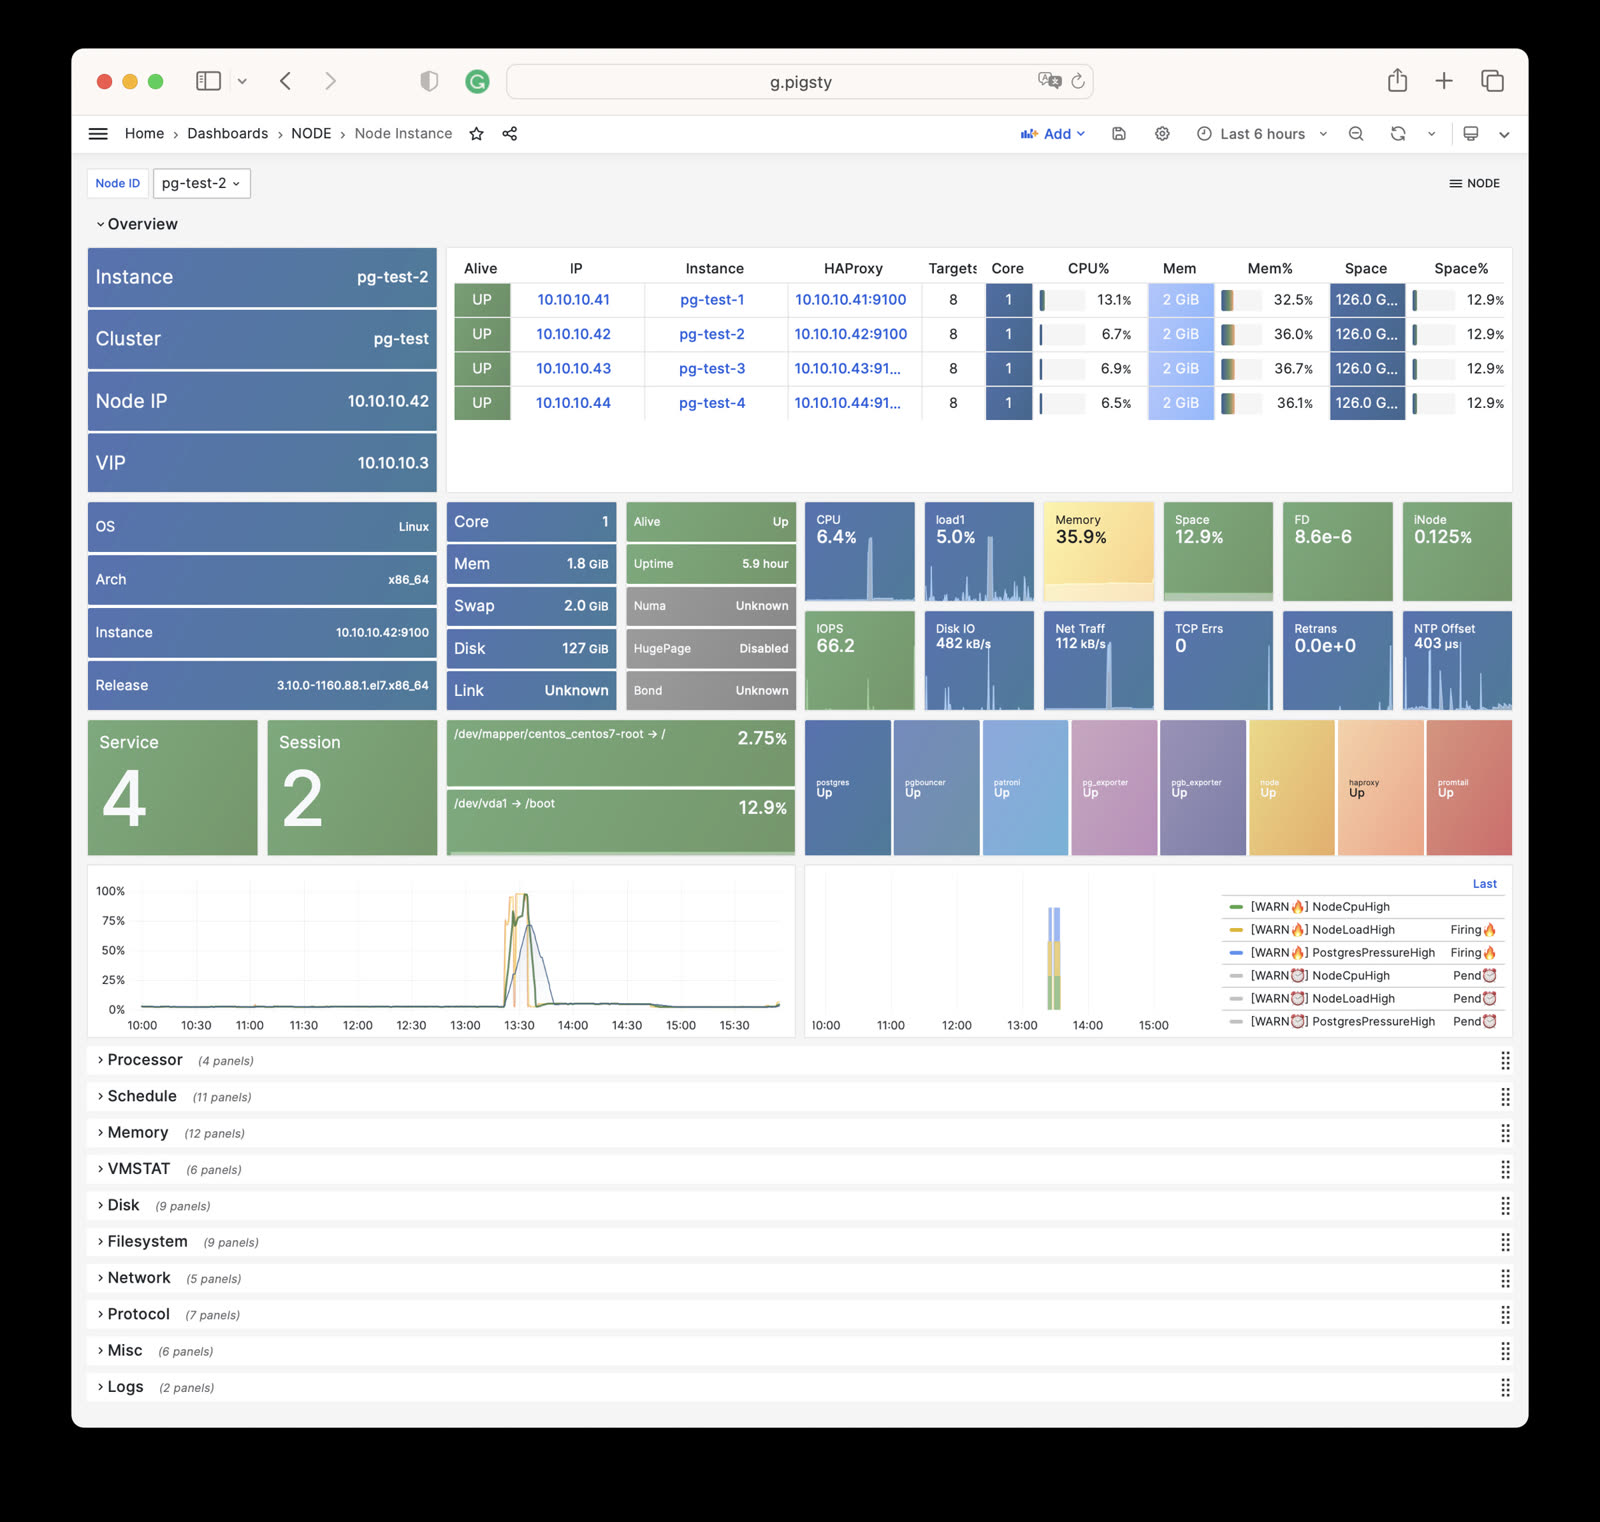
Node Instance
Presents detailed monitoring information for a single host node.
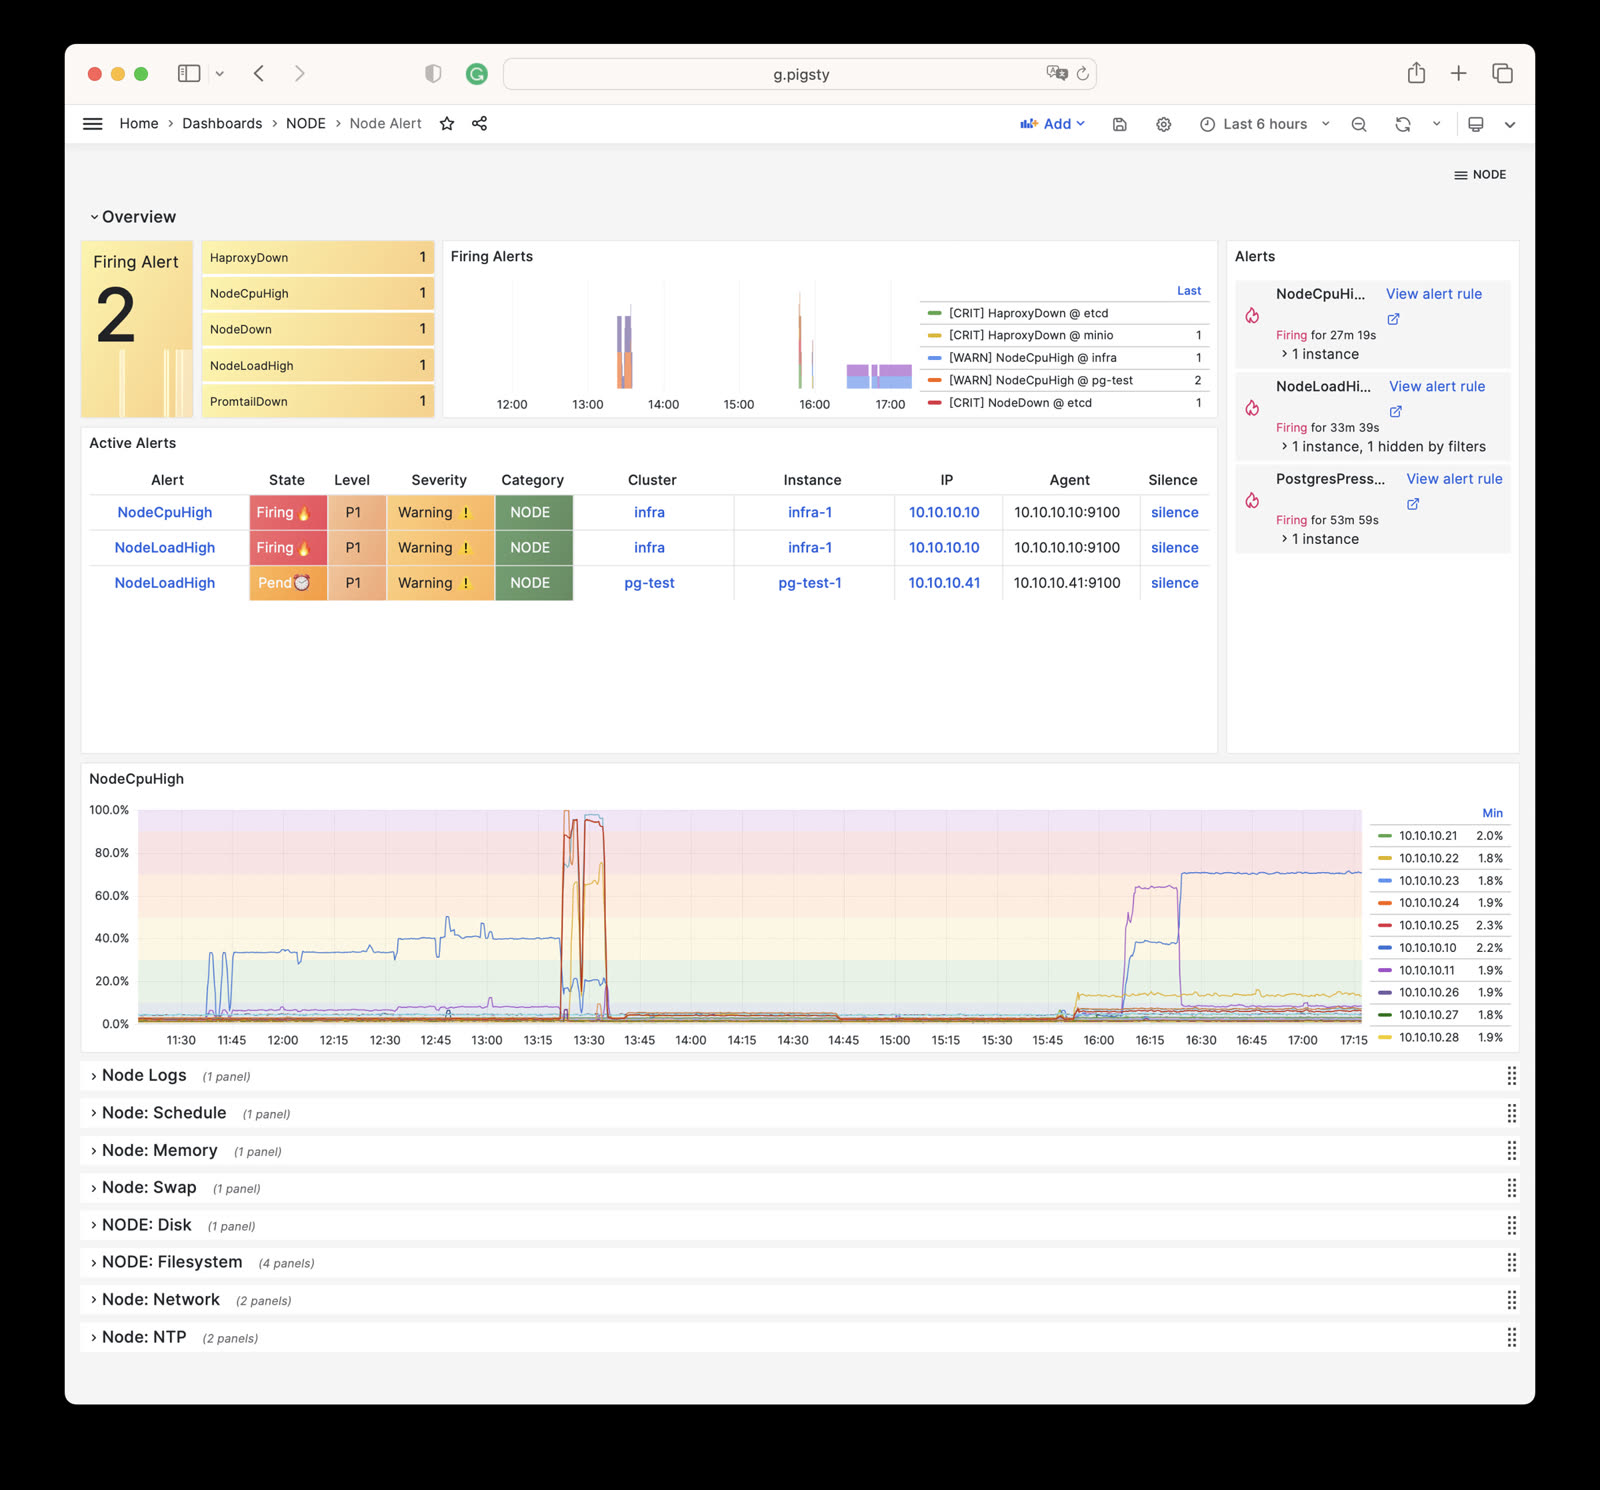
NODE Alert
Centrally displays alert information for all hosts in the environment.
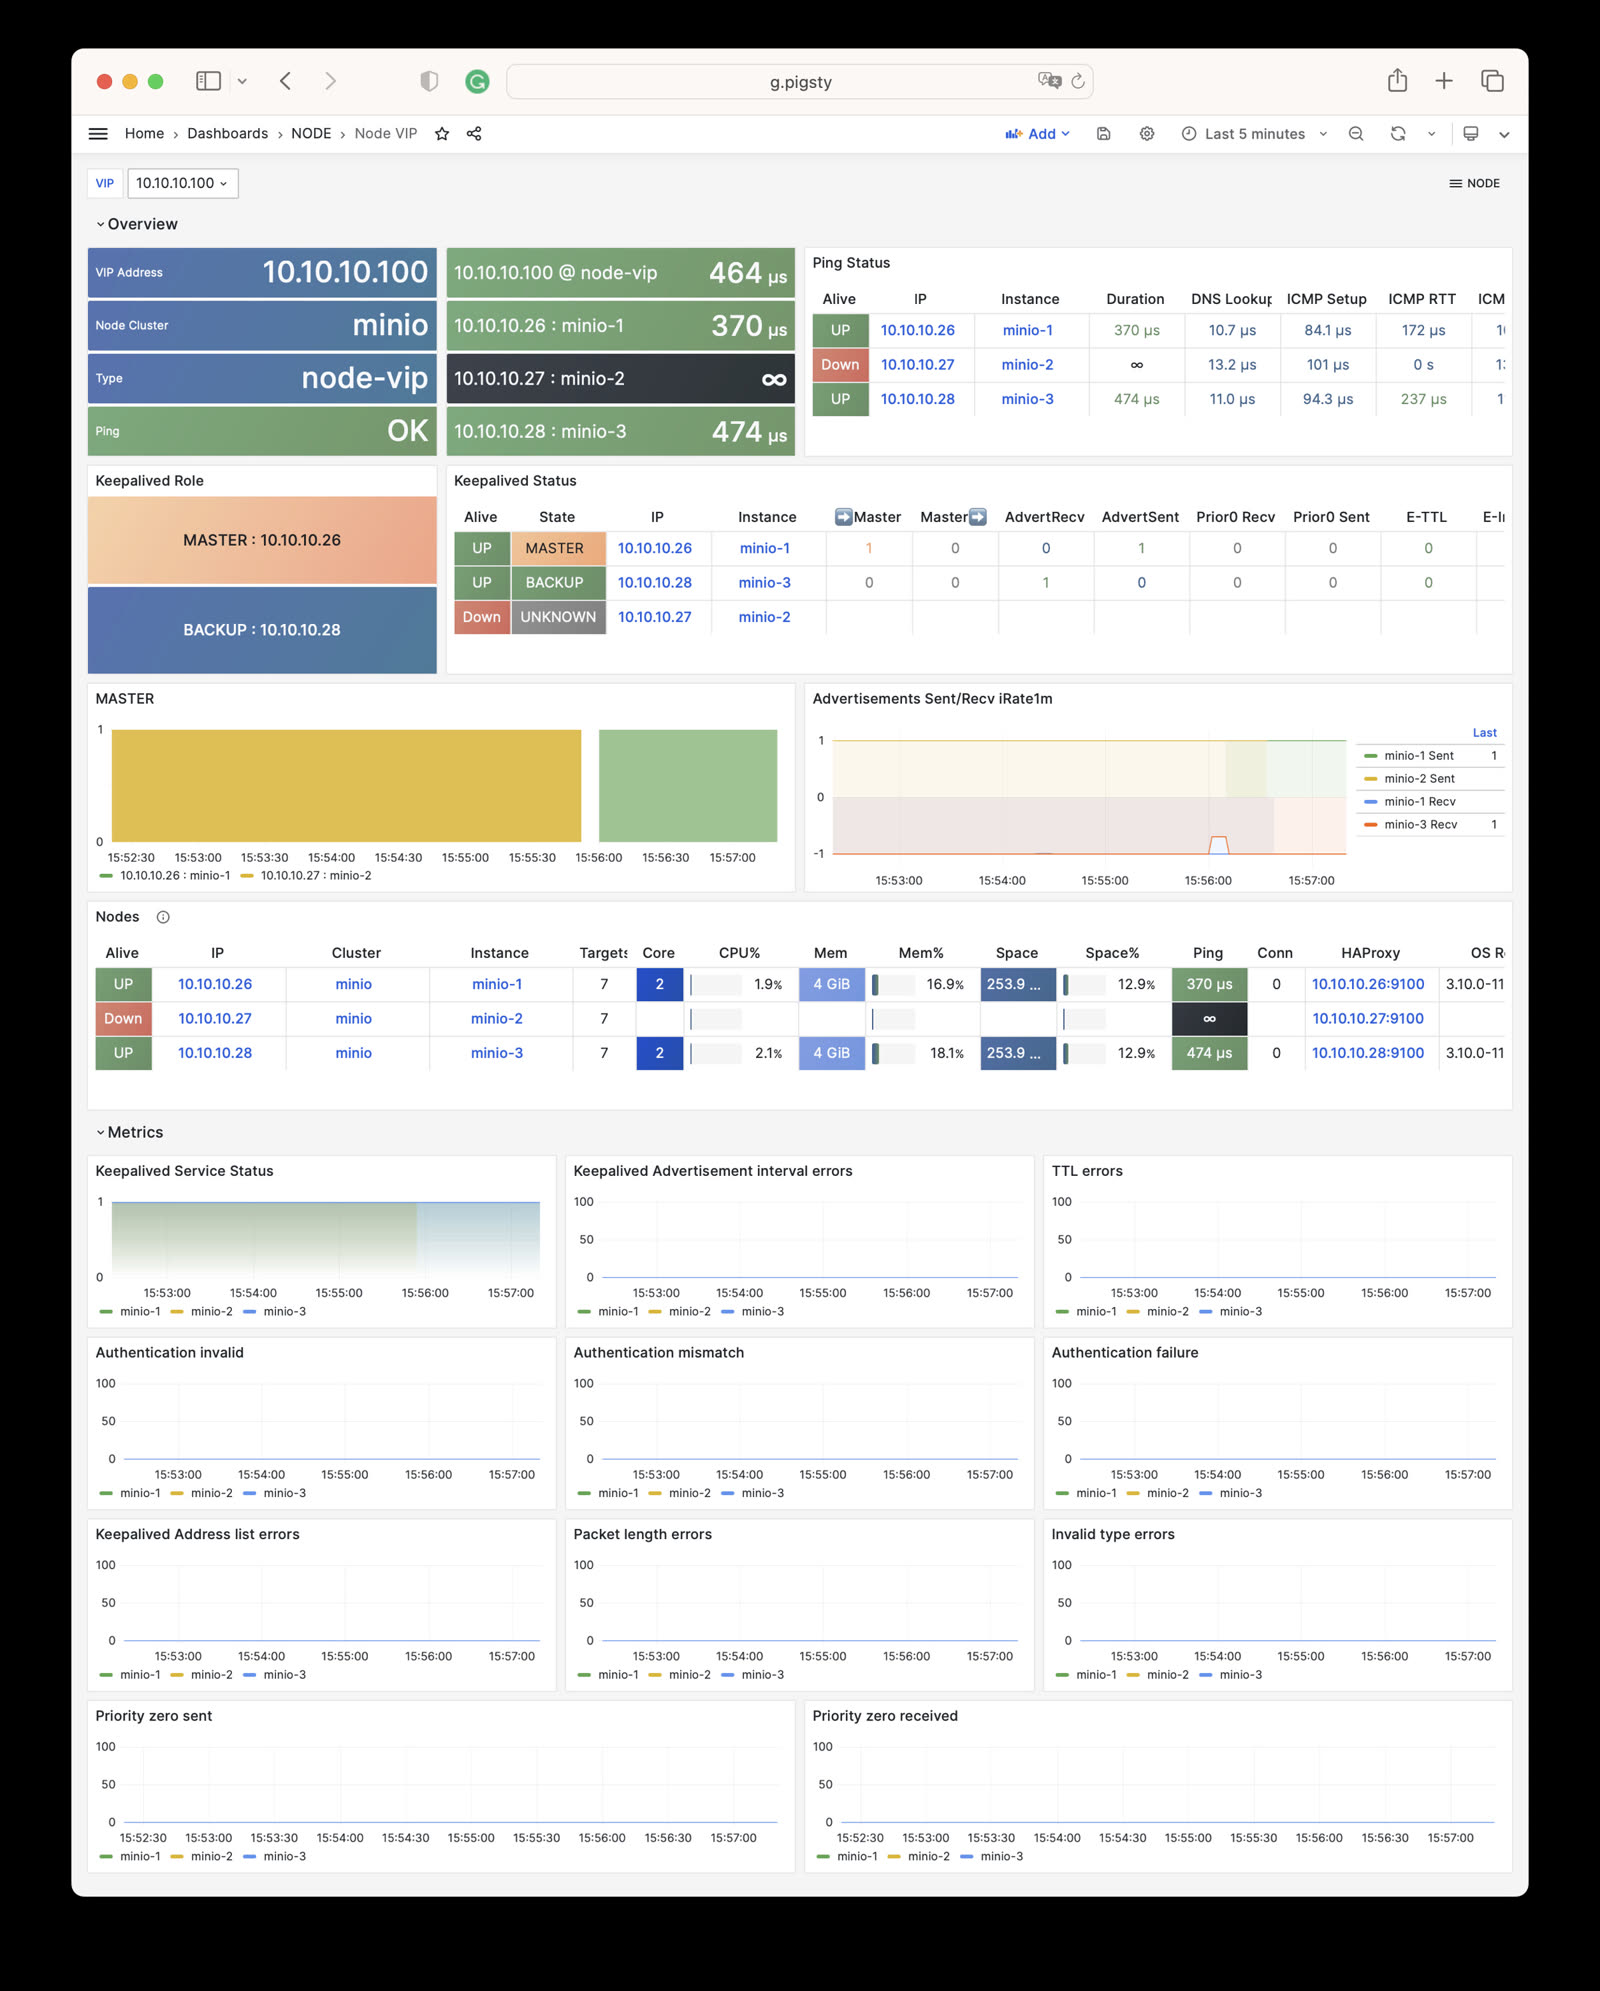
NODE VIP
Monitors detailed status of L2 virtual IPs.
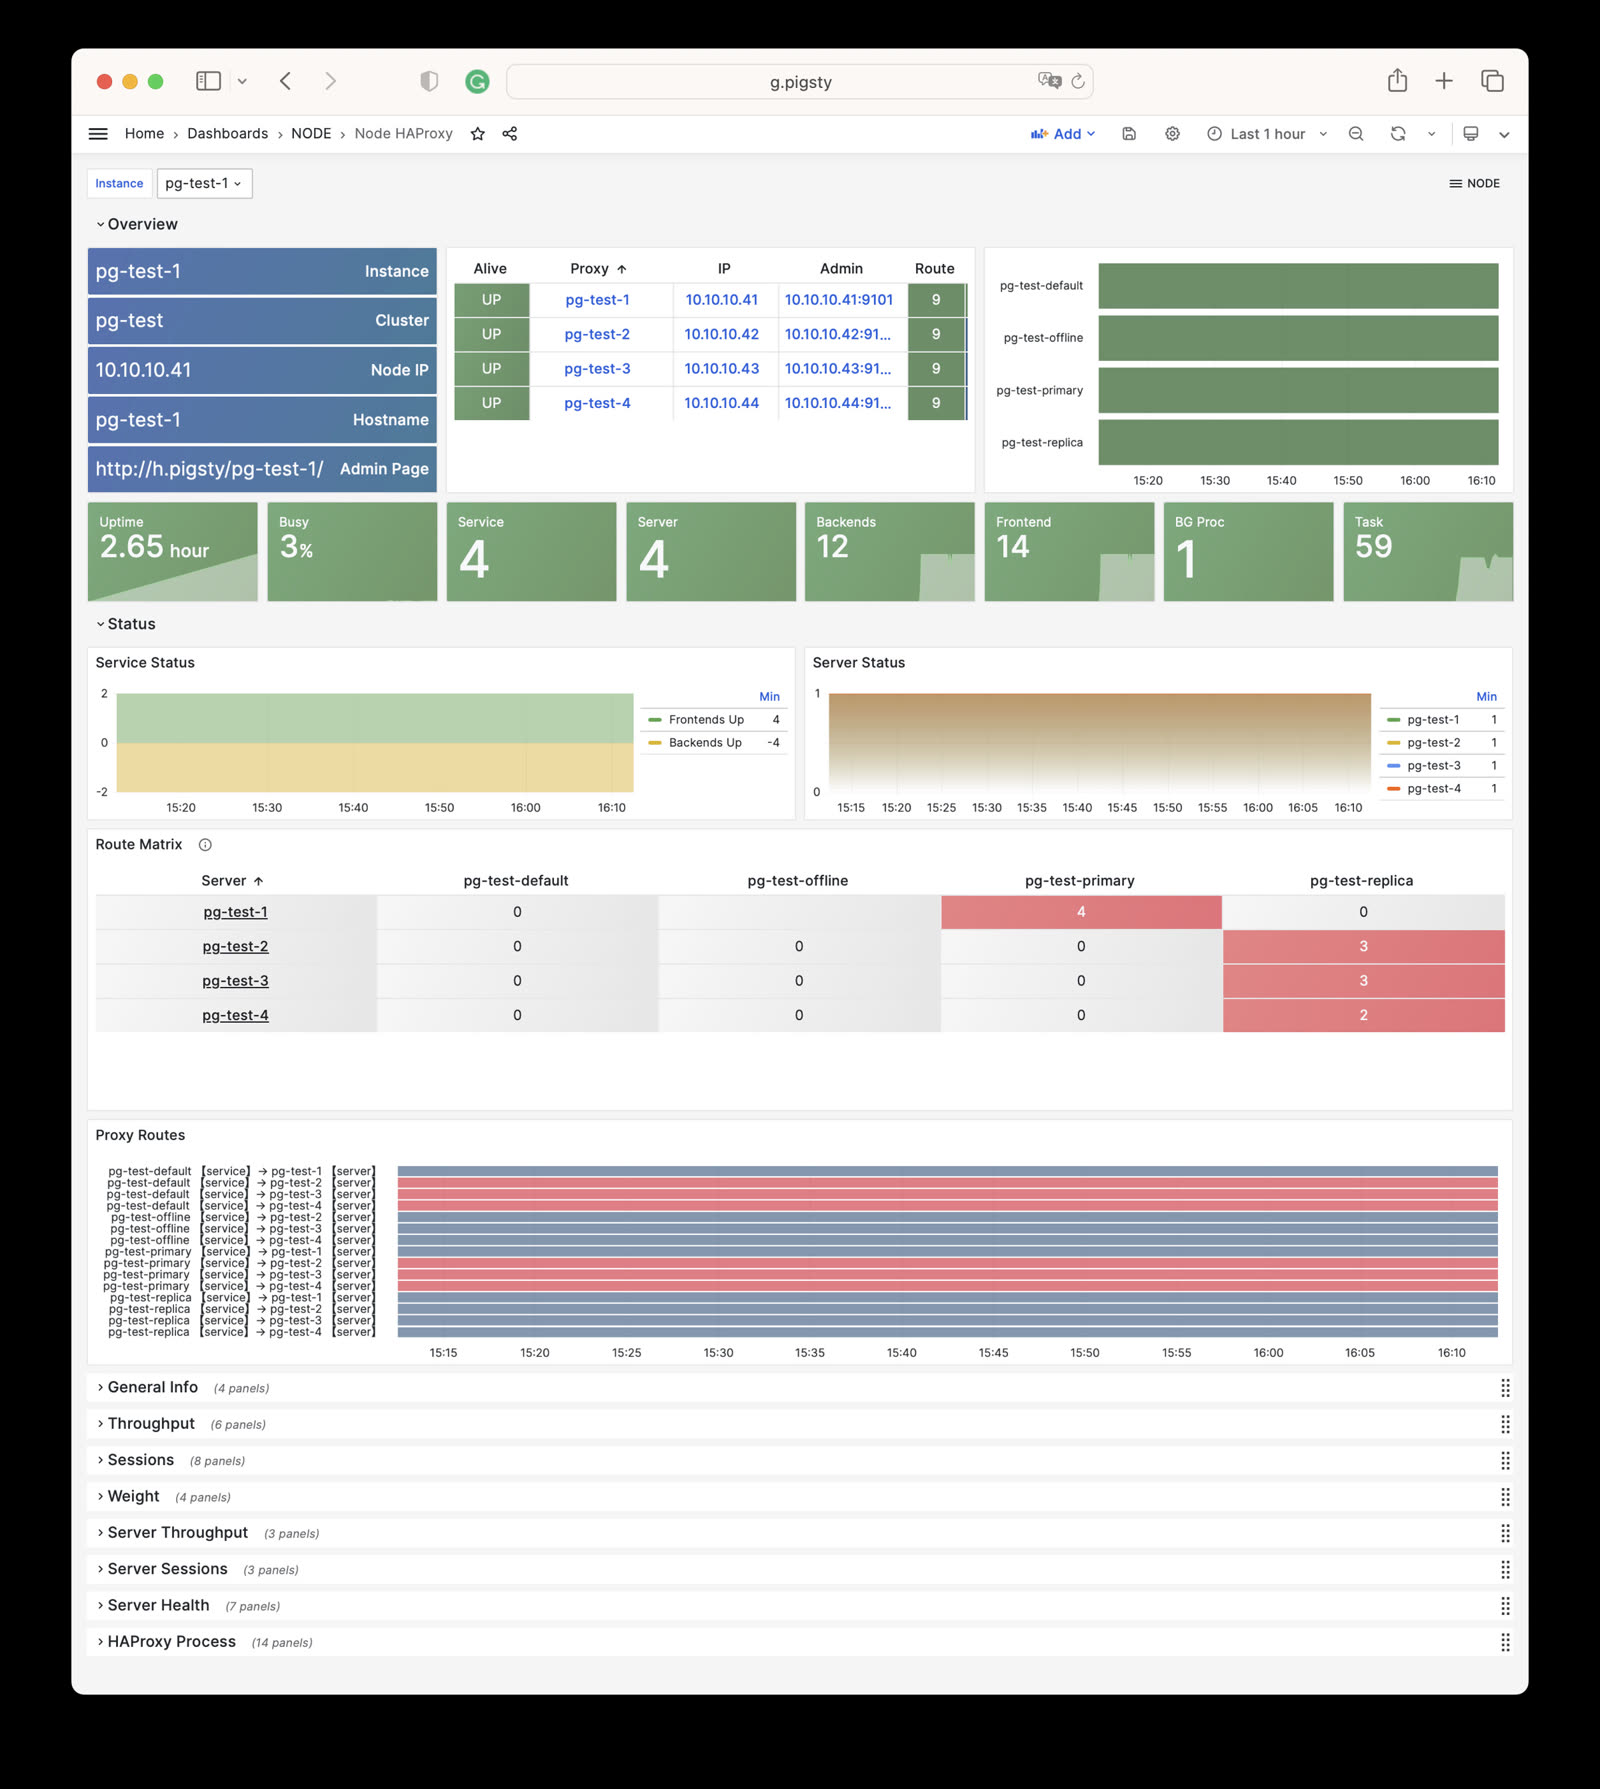
Node Haproxy
Tracks the operational status of HAProxy load balancers.
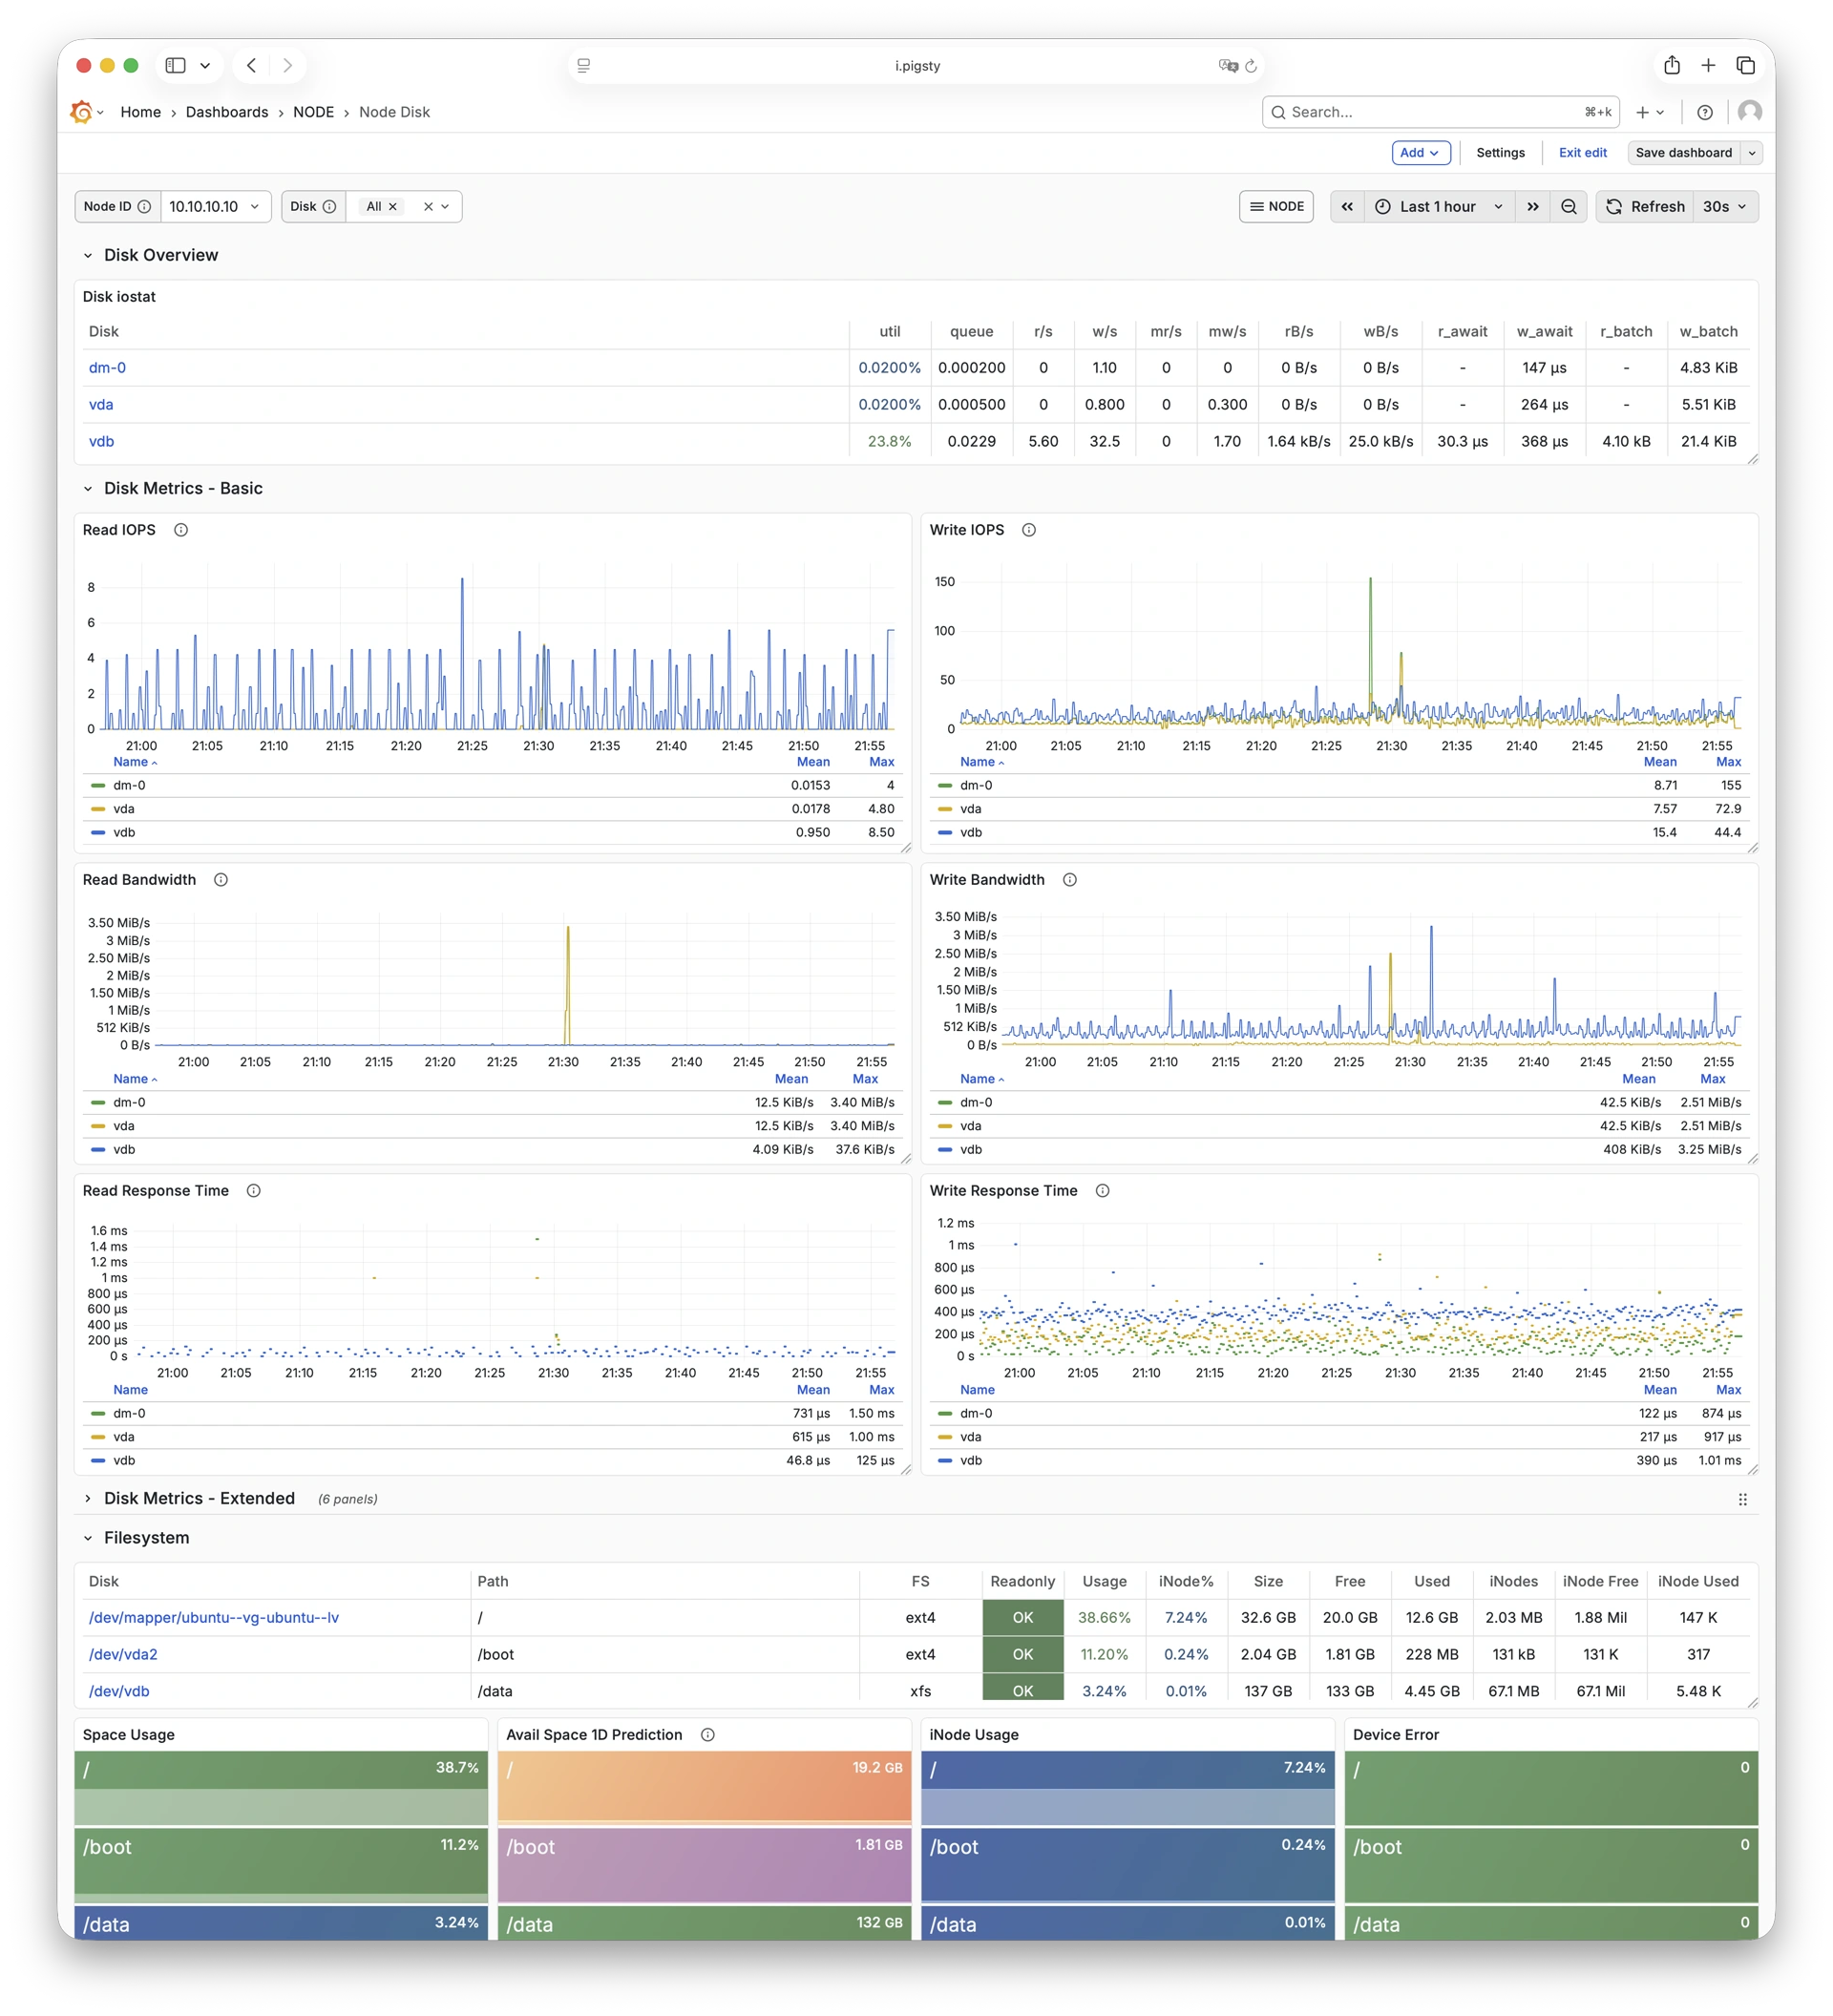
Node Disk
Focuses on per-disk I/O latency, throughput, queue depth, and other storage metrics.
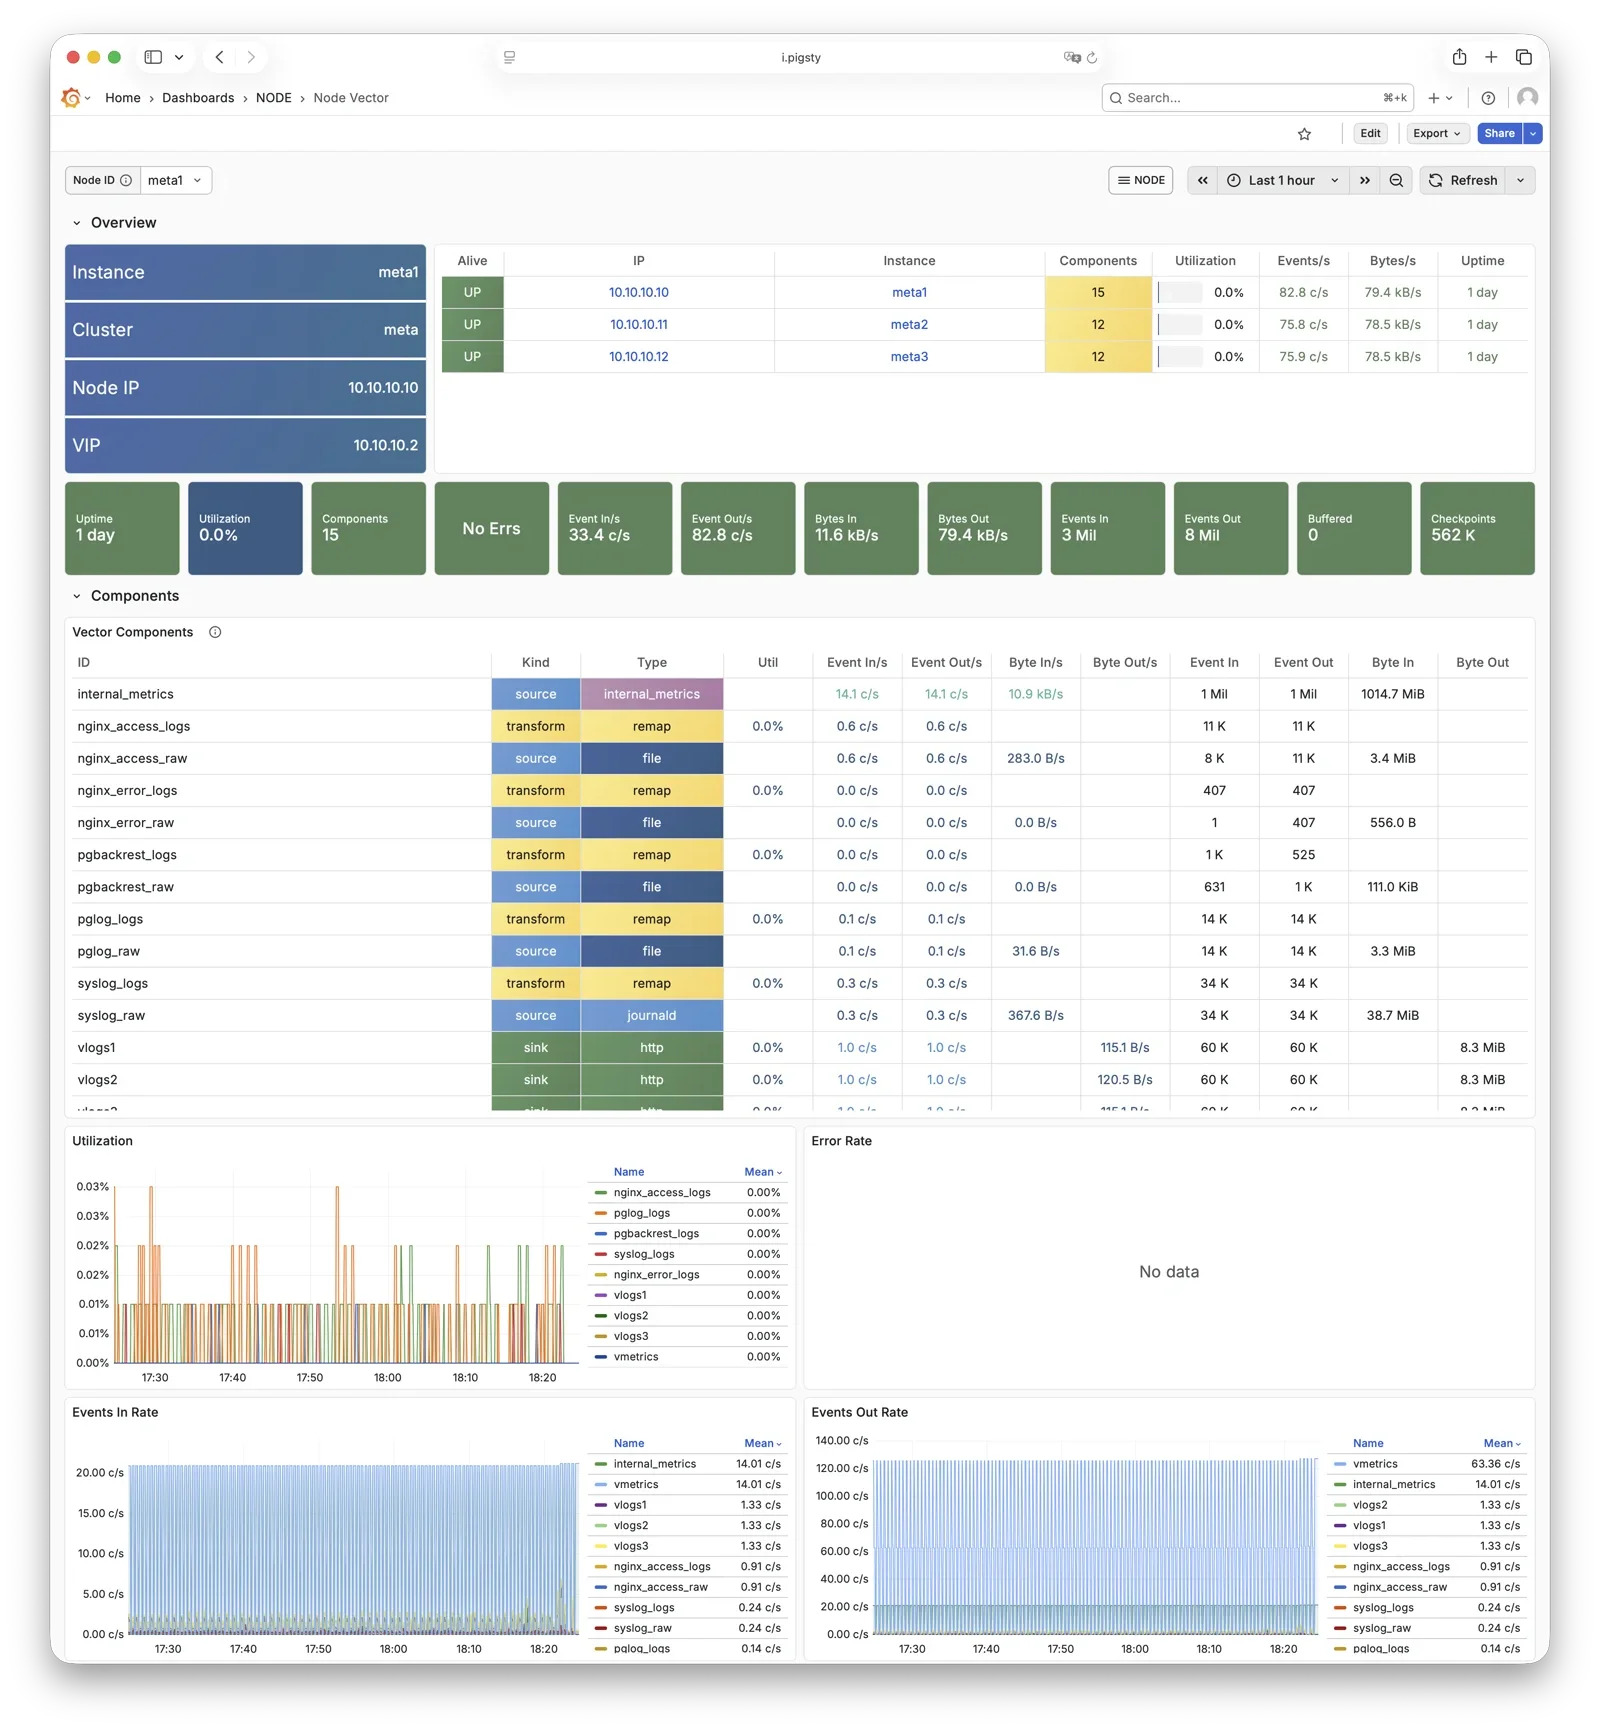
Node Vector
Shows Vector collection and forwarding status, plus log-pipeline health.
Node JuiceFS
Shows JuiceFS client cache, object storage, metadata operations, and read/write performance.
Open the Node JuiceFS Dashboard
Claude Code
Shows sessions, tokens, costs, and logs reported by Claude Code through OpenTelemetry.
Open the Claude Code Dashboard
Alert Rules
Pigsty implements the following alerting rules for NODE:
Availability Alerts
| Rule | Level | Description |
|---|---|---|
NodeDown |
CRIT | Node is offline |
HaproxyDown |
CRIT | HAProxy service is offline |
VectorDown |
WARN | Log collecting agent offline (Vector) |
DockerDown |
WARN | Container engine offline |
KeepalivedDown |
WARN | Keepalived daemon offline |
CPU Alerts
| Rule | Level | Description |
|---|---|---|
NodeCpuHigh |
WARN | CPU usage exceeds 70% |
Scheduling Alerts
| Rule | Level | Description |
|---|---|---|
NodeLoadHigh |
WARN | Normalized load exceeds 100% |
Memory Alerts
| Rule | Level | Description |
|---|---|---|
NodeOutOfMem |
WARN | Available memory less than 10% |
NodeMemSwapped |
WARN | Swap usage exceeds 1% |
Filesystem Alerts
| Rule | Level | Description |
|---|---|---|
NodeFsSpaceFull |
WARN | Disk usage exceeds 90% |
NodeFsFilesFull |
WARN | Inode usage exceeds 90% |
NodeFdFull |
WARN | File descriptor usage exceeds 90% |
Disk Alerts
| Rule | Level | Description |
|---|---|---|
NodeDiskSlow |
WARN | Read/write latency exceeds 32ms |
Network Protocol Alerts
| Rule | Level | Description |
|---|---|---|
NodeTcpErrHigh |
WARN | TCP error rate exceeds 1/min |
NodeTcpRetransHigh |
WARN | TCP retransmission rate exceeds 1% |
Time Synchronization Alerts
| Rule | Level | Description |
|---|---|---|
NodeTimeDrift |
WARN | System time not synchronized |